An overall equipment effectiveness (OEE) drop tells the team which loss category moved: availability, performance, or quality. The physical cause sits on the floor, inside a specific line, shift, and time window. Finding it means narrowing the search to that window, then confirming what happened there before anyone pays for a fix.
The number fell in the weekly review. The stop log looks ordinary, and the team has three theories and no evidence to choose between them. Most of the method runs on records a plant already keeps, and camera evidence counts as one source among several.
The method in brief:
- Start with the loss category that moved, and work through any others separately.
- Narrow the loss to one line, shift, product, or changeover window before looking for causes.
- Confirm what physically happened inside that window, because the log can miss what the line did.
- Measure that window again after the fix, using the same threshold.
OEE Losses and the Six Big Losses Behind Them
OEE losses fall into three categories: availability, performance, and quality. OEE multiplies the three into one figure, so a drop in any of them shows up in the total.
Each category holds two of the six big losses, which come from Seiichi Nakajima's Total Productive Maintenance (TPM) work. Every loss points to its own physical causes and a first set of data to pull.
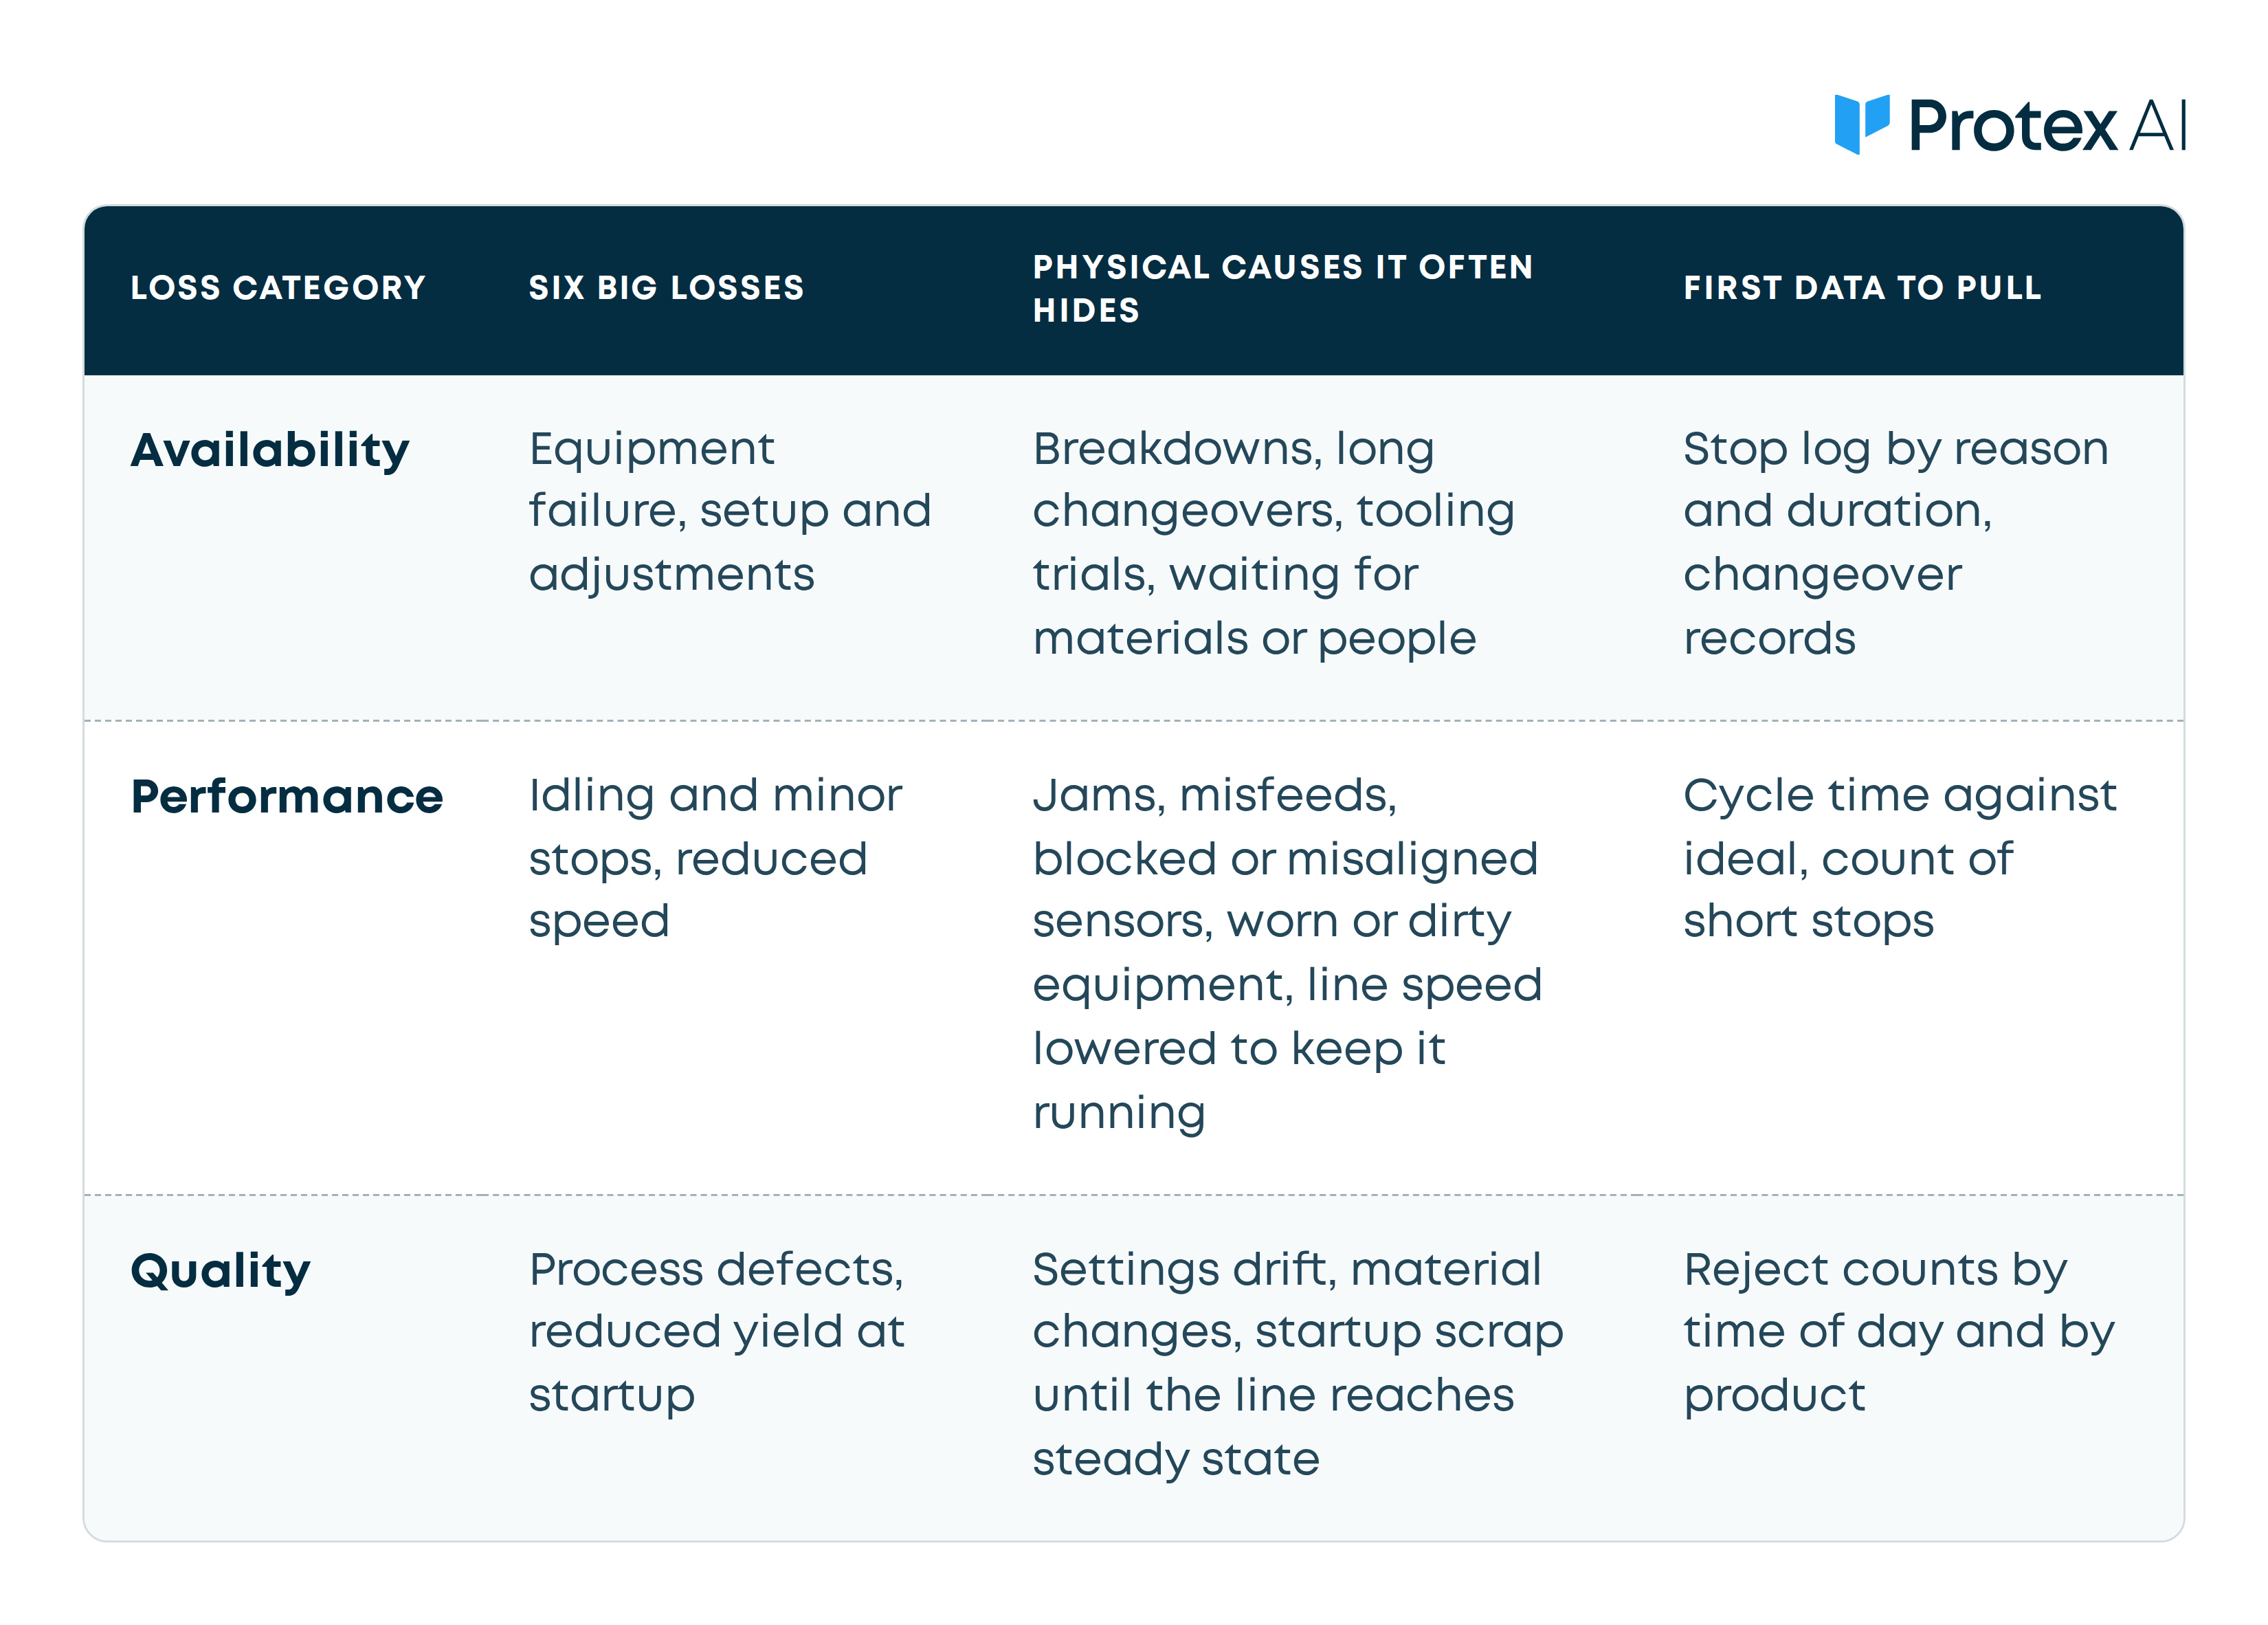
The last column usually costs nothing to pull. It narrows the search before anyone walks the floor.
Why the Stop Log Can Look Normal While OEE Falls
The log records what someone chose to enter, which can differ from how the line actually ran. When OEE falls and the log looks ordinary, the gap often sits in one of three places: stops too short to log, sensor faults, or reasons written after the fact.
Short Stops Below the Logging Threshold
Many sites log only stops above a set length. Frequent short stops then vanish from the record while performance falls, and the log shows a quiet shift on a line that ran slowly all night. Jams that start upstream and spread along a conveyor are a line flow stability problem as much as an OEE one.
Pick one minor-stop threshold, apply it to every line and shift, and write the number down. Sources set it differently, from one or two minutes to anything under five minutes, and none of them holds the single correct number. A shared threshold counts for more than its exact value.
Sensor Faults That Look Like Stops
A blocked or misaligned sensor can log a stop that never happened, or miss one that did. Either error puts the loss in the wrong place.
Reason Codes Written After the Shift
A reason code entered at the end of a shift often reflects memory more than observation. The easiest code to pick can end up collecting stops that had other causes.
How to Trace an OEE Drop to a Physical Cause
An OEE loss analysis runs in six steps: confirm the loss category, narrow the window, list the stops and slow periods inside it, check the floor evidence, name the cause plainly, then recheck that window once the fix is in.
1. Confirm the Loss Category
Compare availability, performance, and quality for the period against the prior baseline, such as the previous four weeks. Carry forward the category that moved most. If two moved, take them one at a time, because mixing them blurs the window in step 2.
2. Narrow the Window
Break the loss down by line, station, shift, product, and changeover until one or two windows hold most of it. A gap between shifts on the same line and the same product is a strong lead, since the equipment and the material stay the same.
One global manufacturer using Protex AI, featured in the Beyond the Clipboard whitepaper, held a 35-minute target for each changeover, but actual times ranged from 25 minutes to two and a half hours. Overrun against the target had reached 70 hours that year at the time of the investigation.
Correlating changeover duration with tooling attempts from lockout/tagout (LOTO) records showed that longer changeovers involved repeated adjustments and machine trials. The single target had grouped changeovers that needed very different tooling work. Existing records narrowed the window and reframed the problem before anyone needed video.
3. List Stops and Slow Periods
Inside the window, list every logged stop and every period where cycle time ran above ideal. Then mark the gaps where output fell with no logged reason, such as line starvation when material stops arriving from upstream. Those gaps are where the record and the floor disagree, and they set the agenda for step 4.
4. Check the Floor Evidence
Confirm what physically happened in each gap with whatever evidence the site has. That can be a floor walk at the same point in the shift, the operator and maintenance technician who were there, machine signals, or video where cameras cover the station and the site's privacy settings allow its use.
To tell a real stop from a false one, set the logged stop beside the output count and beside what the operator or the footage shows at that moment. A logged stop with steady output points to a sensor fault.
Video has limits of its own. It shows what happened in view of a camera, and it cannot show what happened outside the frame or why a person made a choice.
5. Name the Cause Plainly
Write the cause as one plain sentence that a person on the floor would recognize, such as "the infeed jams when carton stock from supplier B runs on nights." If the team cannot write that sentence, the evidence is incomplete, so return to step 4.
6. Recheck the Same Window
After the fix, measure the same loss category in the same line, shift, and product window, with the same threshold. Close the loop only when the loss has moved in that window. A better site average can hide a window that never changed.
When Data Alone Cannot Settle the Cause
Records can pin a loss to a line and a time window and still say nothing about its cause. That is the point to add direct evidence of the floor. Three signs mark it: logged stops and output counts disagree, the loss sits in short gaps with no reason code, or two teams hold different stories about the same stop.
As an illustration, picture a stop that maintenance logs as a sensor fault while the line lead puts it down to late material. Footage of the station shows a forklift parking across the infeed lane during each delivery, which neither record mentions.
Where a site uses video for this check, Protex runs on cameras already in place, with a secure edge device on site. Privacy settings are customizable to each organization's policies, legal requirements, and workforce agreements, and evidence is read at process and station level.
A Repeatable OEE Loss Analysis Routine
Give every OEE drop a one-page record with five lines:
- Which loss category moved
- The window that holds the loss
- The evidence checked
- The cause in one sentence
- The date the same window gets rechecked
Keep the records together, so a cause that returns in March and again in June shows up as a pattern.
The record feeds the engineer's judgment. Engineers decide which evidence holds up, which countermeasure to try, and when the loss in that window has moved. DMAIC (define, measure, analyze, improve, control), standard work, and statistical process control (SPC) still apply, and better evidence makes each of them easier to run.
OEE Root Cause Analysis FAQ
Who Should Join an OEE Root Cause Review?
Bring in the operator and line lead from the shift where the loss sits, the maintenance technician who knows the equipment, and the continuous improvement (CI) engineer who runs the method. Add a quality lead for a quality loss. Beyond the CI engineer, keep the group to people who were there during the window or who own its equipment.
Which Root Cause Tools Work With OEE Data?
A Pareto chart ranks the losses inside the window. A fishbone diagram lists candidate causes across people, method, machine, and material, and the 5 Whys tests a chain of cause one link at a time. Each tool still needs the floor check in step 4 before the team pays for a fix.
How Is Tracing an OEE Drop Different From Fixing Repeat Downtime?
Tracing a drop finds the cause behind one change in the number. A repeat downtime program follows the same stop code week after week until it stops recurring, often by pairing manufacturing execution system (MES) records with video.
Bring Floor Evidence Into OEE Reviews
Where logged stops and output counts keep disagreeing, camera evidence can show what happened at the station. Protex adds that evidence to manufacturing lines through its downtime root cause analysis software, alongside the records a plant already keeps.
Check Out Our Industry
Leading Blog Content
EHSQ industry insights, 3rd Gen EHSQ AI-powered technology opinions & company updates.