

An output drop in an afternoon report is usually a lagging signal. The disruption may have started upstream minutes earlier as material slowed, a buffer drained, or an infeed stopped receiving units.
Finding the source means connecting two records. MES, WMS, scheduling, and equipment data can show when production changed. Physical flow evidence from configured camera zones can add context around material movement, dwell, congestion, and line conditions. Together, those signals help plant teams narrow the investigation before a recurring flow issue turns into a larger output loss.
This is a Site Intelligence workflow: connect the digital record of production with the physical conditions around the line, then give supervisors evidence they can act on.
What this article covers:
- The difference between line starvation, machine downtime, blocked downstream flow, and planned idle time
- The early-warning chain from an upstream slowdown to an output drop
- Seven leading indicators that can surface flow instability earlier
- How to combine MES data with physical flow evidence
- How to confirm that a corrective action changed the pattern
What Line Starvation Is and What It Is Not
Line starvation occurs when a downstream station is available to run but has no material to process because the expected input has not arrived from upstream.
That differs from a machine fault, where the station itself cannot run. It also differs from downstream blocking, where completed material cannot leave the station, and from planned idle periods such as scheduled maintenance or changeovers.
The exact meaning of a "ready" state depends on the site's MES configuration. In many environments, that state indicates that the equipment is available. It does not necessarily prove that material is present at the infeed.
Reading machine-state data alongside material-flow signals helps teams separate starvation from other stoppages.
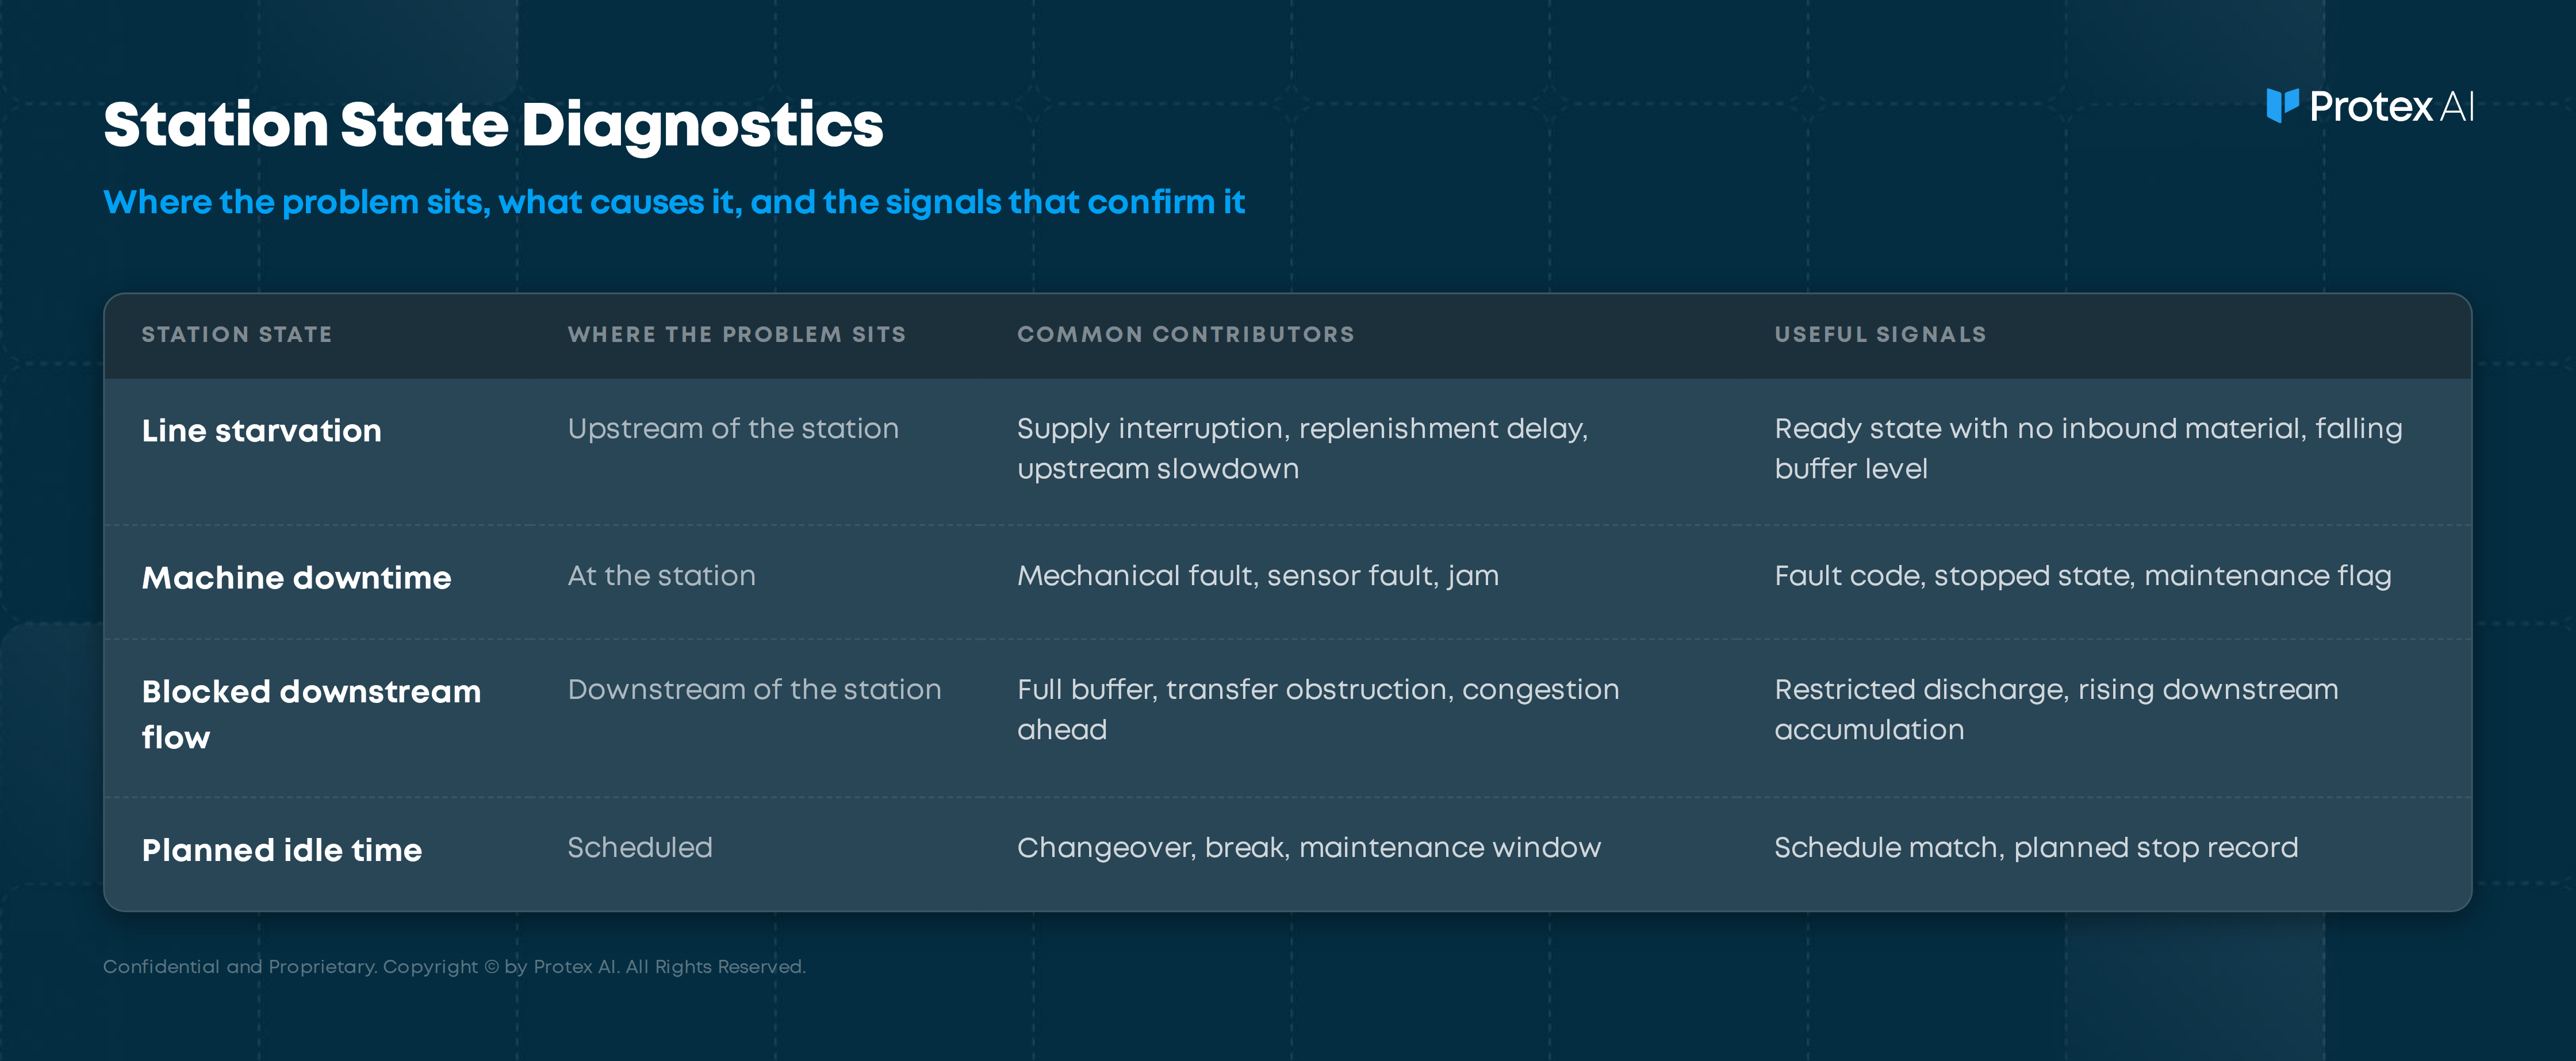
Logging every idle minute as generic downtime can hide the actual constraint. If starvation repeatedly appears under an equipment-stop code, maintenance teams may keep investigating the machine while the material-flow problem remains.
The Early-Warning Chain Before Output Drops
A starvation sequence often develops in stages:
- An upstream slowdown begins - A process stage takes longer than its normal baseline to clear units.
- The gap between units widens - Material arrives less consistently at the next stage.
- The buffer begins to drain - Withdrawals exceed replenishment.
- The downstream station waits - The equipment may remain available while no material reaches the infeed.
- Output reflects the loss - Production totals and Overall Equipment Effectiveness (OEE) show the effect after the physical disruption has already developed.
The timing varies by process. A short accumulation buffer can drain in minutes. A larger buffer may absorb the disruption for longer.
That delay creates an intervention window. Teams that can see the upstream pattern early have more time to address the constraint before it becomes a missed production target.
How Starvation Can Appear in OEE
Depending on the site's OEE model, a scheduled station waiting for material may be classified as an Availability loss. A slow return to a standard rate after materials arrive may affect performance.
Sites should define those classifications consistently rather than assume one rule fits every MES configuration. ISO 22400 provides an industry-neutral framework for manufacturing KPI concepts and terminology, but local OEE definitions still determine how individual losses are categorized.
Seven Leading Indicators of Upstream Flow Breakdown
No single signal proves starvation in every process. A stronger investigation looks for several indicators that converge around the same time window.
- Recurring upstream micro-stops - Short interruptions may create material gaps even when they do not appear as a formal downtime event.
- Growing dwell at an upstream station or transfer point - Units remaining in a configured area longer than the normal baseline can indicate that flow is slowing.
- Infeed inactivity while the station remains available - A ready state paired with no observed inbound movement can support a starvation hypothesis.
- A declining accumulation or buffer level - Where buffer data is available from sensors, PLCs, MES records, or a configured measurement, the trend can provide an earlier signal than waiting for the buffer to reach empty.
- Increasing upstream cycle-time variation - Greater variation can indicate process instability before a sustained stop occurs.
- Longer recovery after short interruptions - A line that takes progressively longer to return to its normal rate may need investigation.
- Congestion or obstruction on the material route - Delayed material handling can interrupt feed even when production equipment remains available.
Build Baselines Around the Actual Process
A single threshold across every shift and product run can generate unnecessary noise.
A complex SKU, planned changeover, or different production schedule may create a normal flow pattern that looks unusual against a plant-wide average. Baselines should reflect the process conditions that materially affect the line, such as product mix, shift, schedule, line configuration, and expected cycle time.
That gives supervisors a more useful question: Is this line behaving differently from comparable production periods?
Combine MES Data With Physical Flow Evidence
Manufacturing sites already generate two useful records.
The digital record comes from MES, WMS, ERP, scheduling, PLC, sensor, and maintenance systems. It can show machine states, production timestamps, buffer readings, downtime codes, schedules, and output changes.
The physical record adds context around what was happening in configured areas during the same period. Computer vision can surface zone-level patterns such as material presence, movement, dwell, congestion, path activity, and stalled flow.
Neither record should be forced to answer questions it cannot support. A configured camera view may show that an infeed was empty or that material movement stalled. It cannot identify a scheduling change stored in an ERP system. MES data may show that a station stopped receiving units without showing the physical condition that contributed to the gap. Joining both records helps teams narrow the cause.
Why Neither Data Source Is Enough Alone
Flow Stability supports this workflow by surfacing line starvation, flow disruption, and related material-movement patterns so teams can investigate upstream constraints instead of treating only the downstream symptom.
When camera data is part of the analysis, privacy controls are configured for each deployment. Protex AI does not use facial recognition or identify people. Each camera view stands alone, so no cross-camera person tracking occurs.
Analysis stays focused on configured zones, equipment, events, movement, congestion, paths, and process patterns. Each camera view stands alone, so Protex does not follow people or vehicles across cameras.
Set Persistence and Escalation Rules
Not every material gap requires intervention. A brief interruption and a sustained no-feed condition call for different responses.
Teams can define rules around the process baseline:
- Threshold - Set the no-feed duration that counts as abnormal for the relevant line and production conditions.
- Persistence window - Require the condition to continue for a defined period before creating a notification.
- Escalation path - Direct the signal to the supervisor or team responsible for that part of the process.
- Owner - Define who confirms the issue, takes action, and closes the follow-up.
The goal is to make the alert meaningful enough that teams know what deserves attention.
No-Feed Event Timeline in a Production Line - An Example
Imagine a filler station remains available for six minutes but receives no incoming material. During the same period, the upstream capping stage records several short interruptions.
A PLC or buffer-level sensor shows the accumulation buffer falling from 85 percent to 12 percent. Physical flow evidence from the configured transfer zone shows fewer units moving toward the filler during the same window.
Plotting those signals on one timeline shows the sequence:
- Upstream interruptions begin.
- Material movement becomes less consistent.
- The buffer level starts falling.
- The filler reaches a sustained no-feed period.
- Output declines after the flow problem has developed.
The combined evidence does not need to claim that one signal proves the entire cause. It gives the supervisor a focused time window and a likely upstream contributor to investigate.
Protex Intelligence can bring operational signals from systems such as MES, WMS, ERP, scheduling, and equipment data into the same site-intelligence layer, helping teams compare production changes with the physical context around them.
Confirm the Cause Before Changing the Process
A ready station with no incoming material strongly suggests a feed problem, but the next question is what created it.
Review the flagged period for evidence, such as:
- An upstream process slowdown
- An empty staging or accumulation area
- A material-handling delay
- Congestion along a transfer route
- A blocked path
- An upstream equipment fault
- A scheduling or replenishment issue recorded in another system
A bottleneck and a starvation event also need to be separated. A bottleneck is a process step that limits sustained output. It can contribute to repeated starvation downstream, but a consistently low rate does not prove that every downstream stop came from that constraint.
The investigation should connect state data, material-flow signals, and the relevant operational records before assigning a root cause.
Measure the Pattern After the Fix
A corrective action matters only if the original pattern changes.
Track a focused set of measures after the change:
- Starvation frequency - How often the affected station reaches a sustained no-feed condition.
- No-feed duration - The total and average duration of confirmed starvation periods.
- Buffer depletion pattern - How quickly the buffer moves toward its low threshold when reliable buffer data is available.
- Recovery time - How long the process takes to return to its expected production rate.
- Lost units or output impact - The production loss associated with confirmed starvation windows.
- Shift-level trend - Changes connected with schedule, product mix, material availability, or other process conditions.
Compare the same measures before and after the corrective action. A sustained decline in starvation frequency or duration provides stronger evidence than a single good shift.
Check adjacent configured zones as well. A change that clears one transfer point may simply move the constraint upstream or downstream.
Turn Line Starvation Into an Earlier Signal
Line starvation becomes expensive when the first reliable warning is the output report.
A stronger approach connects machine states and operational records with physical flow evidence from the line. That gives teams an earlier view of material gaps, a narrower investigation window, and better evidence for the process or layout change that follows.
Protex AI turns existing cameras, systems, and operational data into real-time site intelligence for smarter, safer industrial operations.
See how Flow Stability helps teams identify line starvation, investigate upstream flow constraints, and act before recurring disruptions affect output.
Check Out Our Industry
Leading Blog Content
EHSQ industry insights, 3rd Gen EHSQ AI-powered technology opinions & company updates.
.jpg)
.avif)
.avif)