

%20(31).png)
You know a shift is losing time, but proving where those minutes go is harder. Raw traffic volume can distort the picture, and a longer travel path does not automatically tell you what caused it. Operations and industrial engineering teams need a repeatable way to compare flow using site-specific evidence.
Path efficiency analysis connects physical movement patterns with operational data so teams can identify recurring route loss, investigate likely contributors, and test layout or process changes. Protex AI supports this through Site Intelligence that combines existing cameras, configured zones, and operational systems.
Article highlights:
- Route deviation and travel time show how movement differs from the intended operational layout.
- Fair shift comparisons require similar workload, product mix, and operating periods.
- Camera-based movement patterns add physical context around likely causes of route loss.
- A four-step validation sequence helps teams test layout and process changes against the original baseline.
What Path Efficiency Analysis Measures
Path efficiency analysis compares movement through a defined workflow against the intended operational layout. Protex AI's Facility Flow & Layout Insights can continuously measure route deviation and travel time, giving operations teams evidence about how flow changes across shifts and operating periods.
Combine Physical and Operational Data
Two data streams make the analysis more useful. Facility Flow & Layout Insights provides the physical record. It shows aggregate movement patterns, route deviation, travel time, congestion, and intersections inside configured camera views. Operational systems, such as a Warehouse Management System (WMS) or Labor Management System (LMS), provide the transactional record, including completed picks, dock runs, order volume, and other workload measures.
Joining the two helps teams distinguish a genuine flow issue from a shift that simply handled more work.
Keep Measurement Anonymous and Pattern-Level
Privacy stays built into the camera-based analysis. Protex works with existing CCTV and analyzes defined zones rather than named individuals.
Privacy controls are configured for each deployment. Protex AI does not use facial recognition or identify people. Each camera view stands alone, so the platform does not follow people or vehicles across cameras.
The goal is pattern-level improvement. Operations teams can identify where routes repeatedly deviate, where travel time rises, and where congestion appears without turning the analysis into individual performance monitoring.
Map the Intended Route and Choose Comparison Periods
A useful baseline starts before the team compares shifts. Define the intended operational layout for the workflow, then select periods that make a fair comparison.
Define the Intended Route
A supervisor or industrial engineer can document the expected path inside the configured area. That might cover a pick sequence through a group of aisles, movement between production stations, or a dock route between staging and a truck bay.
The reference gives route deviation a practical meaning. Instead of asking if movement looks inefficient, the team can compare observed flow against the layout or route the operation intends to support.
Choose Representative Shift Periods
A peak-volume shift should not be compared directly with a quiet period and treated as proof of a layout problem. Match comparison windows as closely as possible across:
- Shift duration - Similar operating periods prevent longer shifts from dominating the comparison.
- Product or order mix - Comparable work reduces distortion from fundamentally different handling requirements.
- Workload - Order volume, completed moves, production quantity, or another site-specific output measure gives movement data the operating context it needs.
- Site conditions - Major maintenance, unusual staffing constraints, temporary storage, or other exceptional conditions should be recorded before interpreting the result.
The baseline should reflect normal operating conditions closely enough that a route or travel-time difference deserves investigation.
Compare Route Deviation With Workload
Route deviation and travel time describe the physical flow. Workload data explains how much work the shift completed while that flow occurred.
Keep the Measurement Basis Clear
ISO 22400-1 provides an industry-neutral framework for defining and using manufacturing operations KPIs.
For path-efficiency analysis, the practical takeaway is to document each metric and keep comparison conditions consistent, while treating route deviation as a site-specific measure rather than an ISO-defined KPI.
Do not collapse the two data streams into an unsupported proprietary formula. Compare them side by side.
Compare the Signals Side by Side
For example, imagine Facility Flow & Layout Insights reports a 20% route deviation and a 96-second average travel time during Shift A. The site's WMS records 42 completed moves per hour over the same period. Shift B shows lower route deviation and shorter travel time while processing a similar product mix and workload.
That pattern gives the team a reason to investigate Shift A. It does not prove that route deviation caused lower output.
The same principle applies to equipment-heavy workflows. If forklifts are part of the process, Asset Utilization can add evidence about equipment idle time and usage patterns. That keeps asset availability separate from route loss instead of treating every delay as a facility-flow problem.
Compare Paths Across Shifts
A single period establishes performance against the intended layout. Cross-shift analysis shows if the same configured area behaves differently under comparable operating conditions.
Build a Shift-Comparison Table
The example below is illustrative only. It is not customer data or a Protex benchmark.
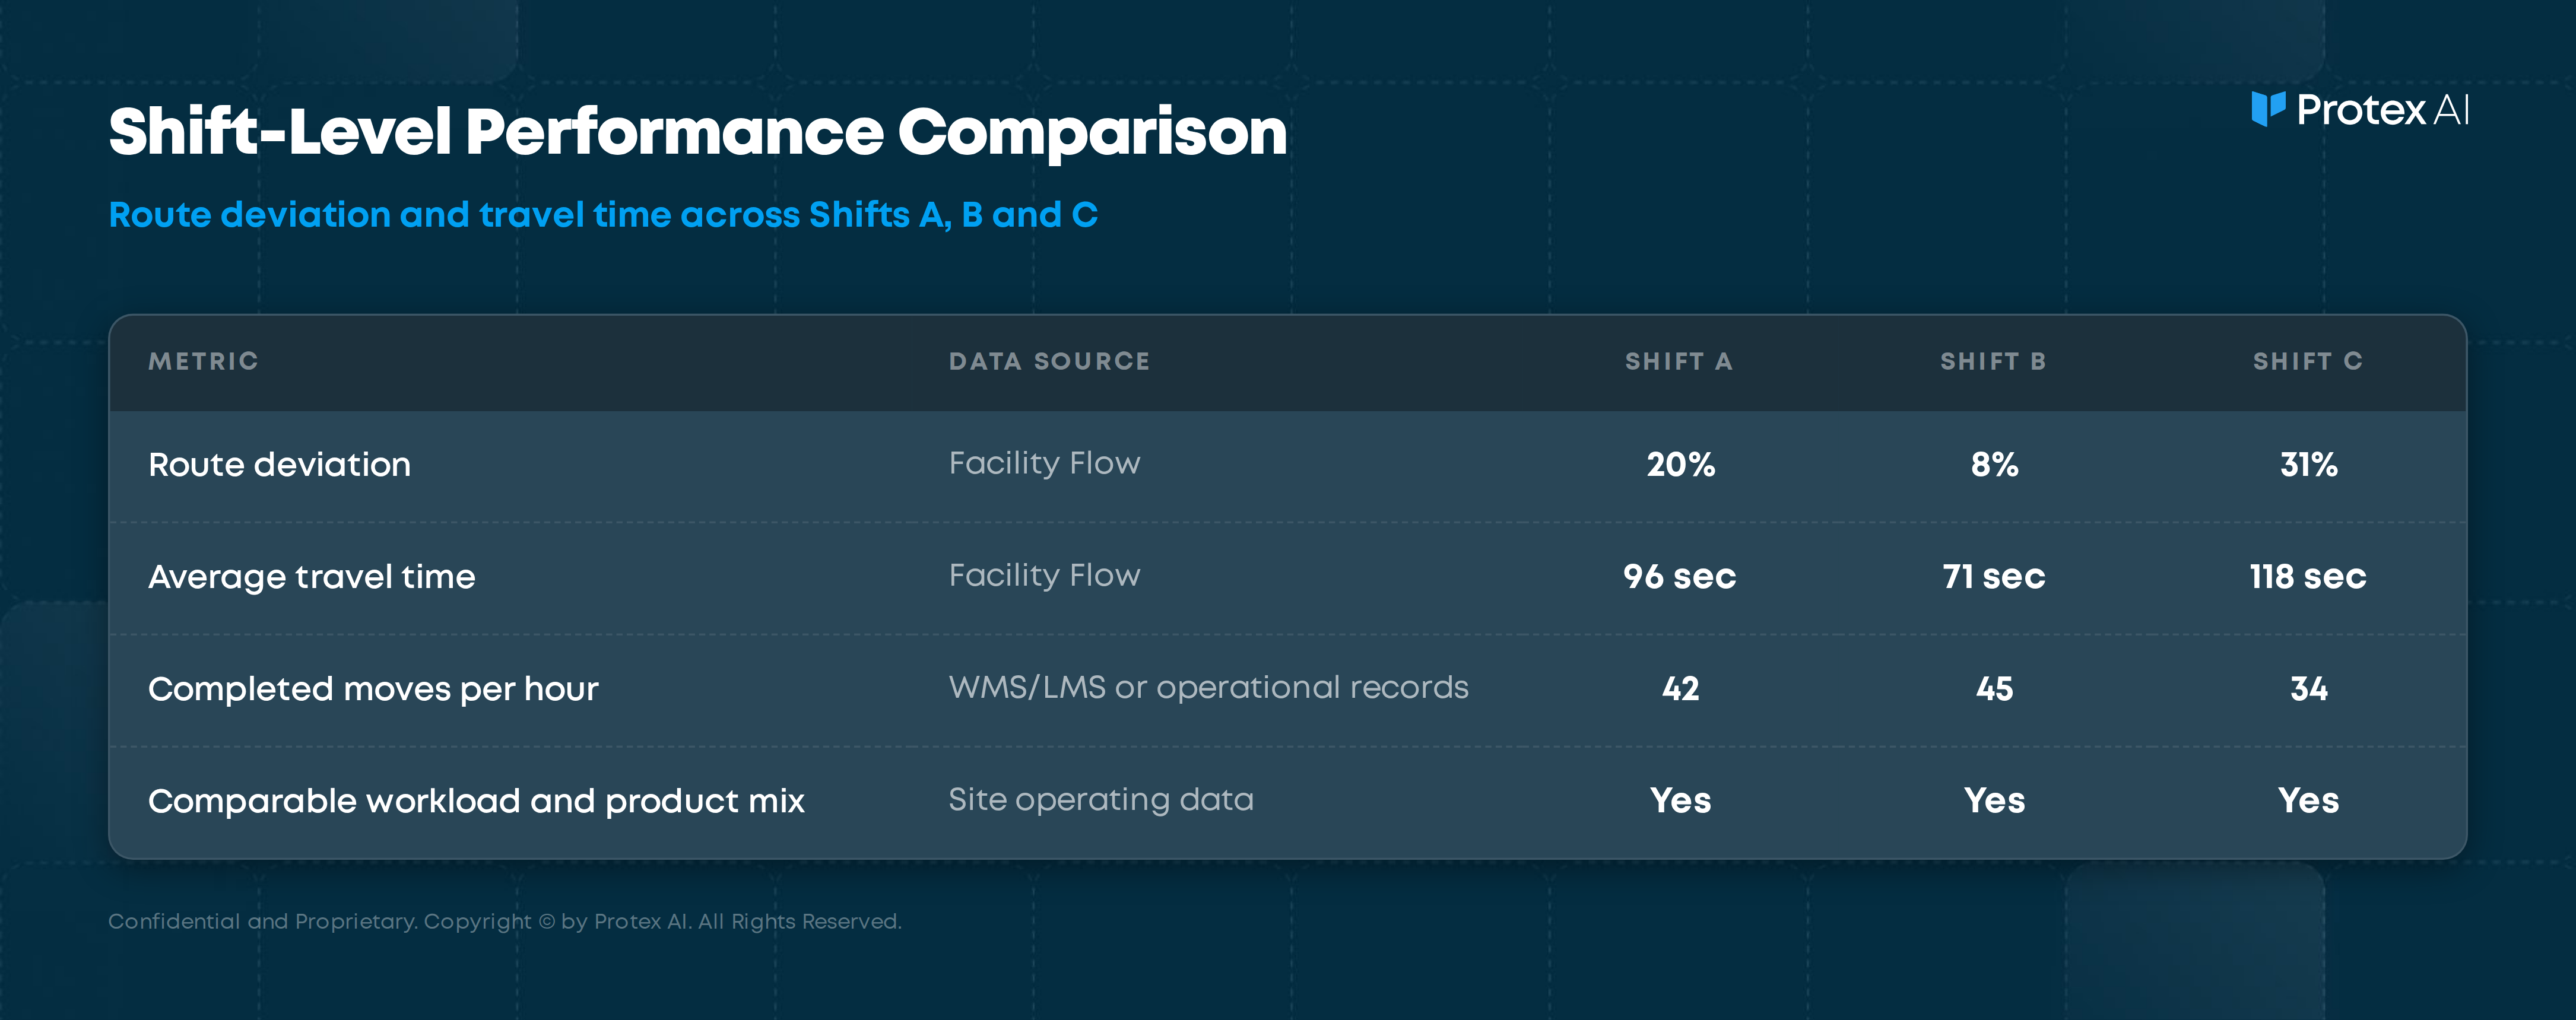
The table makes the investigation more precise. Shift C has the highest route deviation and longest travel time while processing a comparable workload. That does not identify the cause, but it tells the team where to look first.
Area Utilization can add another layer of context by showing how defined spaces are used across shifts and time periods.
Inspect Likely Contributors With Physical Context
Route and travel-time patterns can support root cause analysis around recurring delays.
A repeated detour around a blocked pallet may add travel. Queueing near a dock door can increase time through the area. Crossing traffic at an intersection can create a recurring flow constraint. The physical evidence helps teams see which contributors repeatedly appear during periods of higher deviation.
Treat that evidence as context, not automatic proof of causation. A route pattern may surface a contributor that still needs to be checked against workload, scheduling, equipment availability, or another operating condition.
Flow problems can also have a safety dimension. Congested intersections and overlapping vehicle and pedestrian routes can increase interaction exposure. Teams changing forklift routes should review relevant vehicle control measures alongside the proposed layout.
Test a Layout or Process Change and Validate the Result
A before-and-after comparison works best when the team changes one defined part of the workflow and measures it against the same baseline.
- Confirm the baseline - Record route deviation and travel time for the affected configured area alongside workload and operating conditions.
- Introduce the change - Reroute a path, change staging placement, widen an aisle, adjust a handling method, or make another defined process improvement.
- Re-measure a comparable period - Use the same configured area and normalization context so the post-change result can be compared with the baseline.
- Review the outcome - Compare route deviation, travel time, output, congestion, and nearby flow patterns to identify what changed and check that the constraint did not simply move elsewhere.
This process creates a site-specific before-and-after record instead of relying on an industry benchmark.
In an operations-enablement scenario, path analysis identified a U-path that the team treated as a high-risk intersection. The team rerouted forklifts and introduced hand-operated pallet jacks to improve safety and flow in the high-traffic area.
That example shows the decision path that matters: identify the pattern, change the site condition, then compare the result.
Common Questions About Path Efficiency Analysis
How Is Warehouse Path Efficiency Measured?
Path efficiency can be assessed with route deviation and travel-time measurements compared with the intended operational layout. Workload measures from a WMS, LMS, or other operating records add context so teams can compare periods with similar levels of activity.
What Causes Wasted Motion in Warehouse Workflows?
Common contributors include blocked routes, congestion, queueing, crossing traffic, poor staging placement, repeated handoffs, or layout choices that force unnecessary travel.
The movement pattern identifies where to investigate. Operational data and site context help determine which contributor deserves action.
How Do You Compare Travel Paths Across Shifts?
Start with comparable operating periods. Match workload, product mix, shift duration, and major site conditions as closely as possible. Then compare route deviation and travel time alongside output data from the site's operational systems.
The objective is not to rank teams. It is to identify process and layout conditions that repeatedly create extra travel or delay.
Can Existing CCTV Support Path Efficiency Analysis?
Yes. Protex works with existing camera infrastructure through CCTV integration, with analysis focused on configured zones and aggregate site patterns.
Camera streams are processed locally through edge infrastructure rather than sending continuous raw CCTV to the cloud. Protex does not use facial recognition or individual identification, and each camera view is analyzed independently rather than tracking people across cameras.
Turn Path Evidence Into a Site Improvement
Wasted motion can appear as longer travel time, recurring congestion, lower output, or a route that regularly drifts from the intended layout. The useful question is not who took longer. It is what the site condition keeps creating the same pattern.
Path efficiency analysis gives operations teams a repeatable way to establish that baseline, connect movement with workload, investigate contributors, and measure the result after a layout or process change.
Recovered time should trace back to the site's own evidence. That creates a stronger basis for process changes, layout decisions, and investment discussions than a universal benchmark ever could.
See how Protex AI's Facility Flow & Layout Insights measures route deviation and travel time.
Check Out Our Industry
Leading Blog Content
EHSQ industry insights, 3rd Gen EHSQ AI-powered technology opinions & company updates.
.jpg)
.avif)
.avif)