

%2520(29).png)
A forklift clips a rack. The line stops. The safety team reviews the event, Operations checks the lost time, and everyone realizes the warning signs were already on the floor.
Leading and lagging indicators help EHS and Operations read those warning signs together. Lagging indicators show what already happened. Leading indicators show where risk, congestion, overdue actions, or process drift may be building before an injury, stoppage, or missed target lands.
In this article:
- How leading and lagging indicators differ for EHS and Operations teams.
- Which weekly leading indicators reveal near misses, congestion, training gaps, and overdue corrective actions.
- Which monthly lagging measures leadership should review, including TRIR, DART, LTIR, OEE, downtime, and throughput variance.
- How to segment safety and operations signals by shift, zone, department, and site.
Why Separate Scorecards Create Blind Spots
Most sites measure safety with injury rates and track operations with throughput. Both teams look at the same warehouse floor, production area, or dock, but they often review the data too late. The result is two scorecards, two meetings, and one shared blind spot.
The better approach is a shared metric system that shows what happened, what is likely to happen next, and who owns the response. TRIR formula and rate-calculation detail belong in a separate incident-rate guide. Here, the focus is which indicators to track, when to review them, and how EHS and Operations can act from the same site signals.
For Protex AI, this is a site intelligence problem: the same floor signals that reveal risk often explain flow, downtime, and resource pressure.
What Each Indicator Type Actually Tells You
Leading indicators look forward. They show if safety activities, site conditions, and operational processes are moving in the right direction before an incident or stoppage occurs.
Lagging indicators look backward. They measure events that have already happened, such as injuries, illnesses, lost time, downtime, or throughput variance.
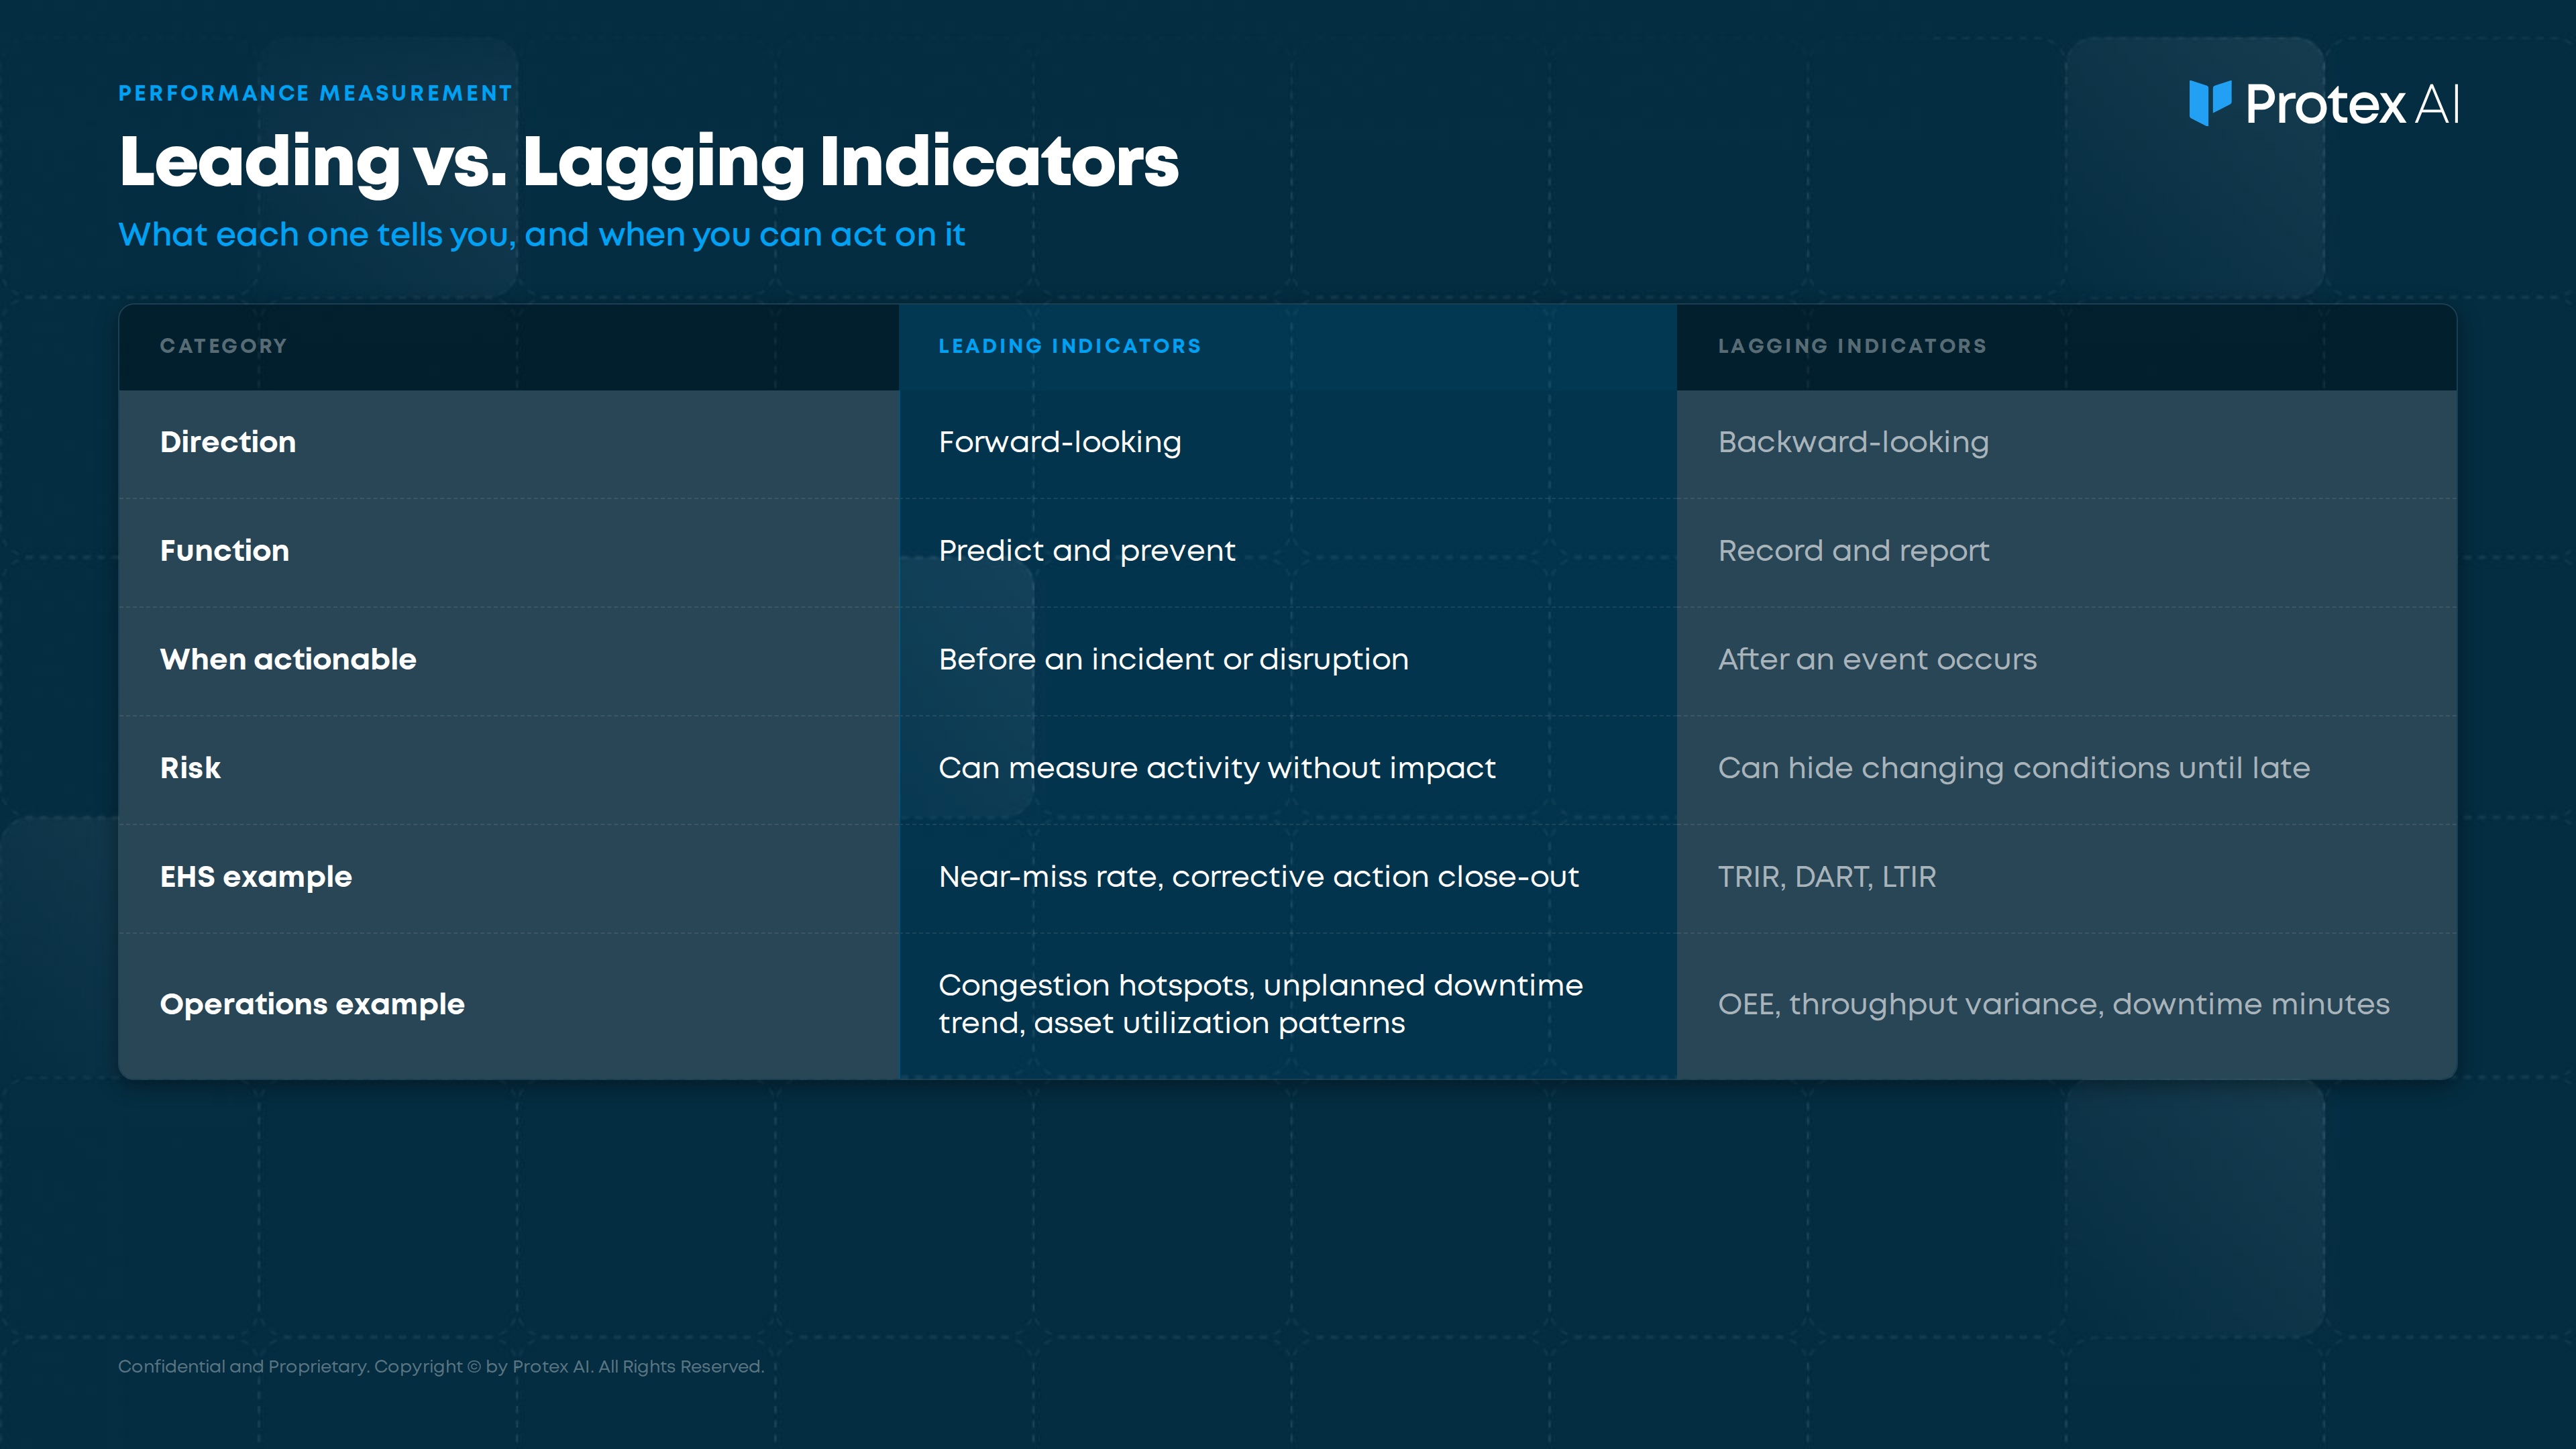
A metric can shift category depending on cadence and use. A rising weekly downtime trend can act as an early warning sign, while monthly downtime minutes remain a lagging outcome measure because they record disruption after the cost has already landed.
The Limits of Lagging Metrics Alone
Relying entirely on lagging numbers means the team only gets a clear view after the cost has landed. Operations metrics such as downtime, congestion, and idle periods belong in the same conversation as safety data because they often point to the same floor-level condition.
What Industry Guidance Says About These Metrics
The Center for Chemical Process Safety, an AIChE Technology Alliance, defines lagging process safety metrics as retrospective and leading metrics as forward-looking indicators of work processes, operating discipline, or protective layers that help prevent incidents.
Its process safety guidance recommends using leading, lagging, and near-miss metrics together inside internal safety management systems.
Leading indicators only work when they lead to action. Near-miss reporting is a practical place to start because it gives supervisors a repeatable signal to review every week. Near misses become stronger leading signals when teams trend them by zone, shift, and cause, then act before more severe outcomes occur.
Why EHS and Operations Misalign When Lagging Metrics Dominate
Safety data and operations data should not tell two separate stories about the same floor. A congested pick zone, a backlog of corrective actions, and a recurring downtime pattern may all point to the same root cause.
In practice, the split often looks like this. EHS reviews injury rates during one meeting, while Operations reviews downtime in another. Neither team sees that congestion inside a high-traffic zone and overdue actions in the same area are connected.
Moving Beyond Lagging Indicators
Area utilization analysis helps operations teams see underused zones, crowded spaces, and layout issues that can affect both safety and flow.
DART and TRIR are commonly used lagging measures, but they reflect events that already happened. They cannot show the next corrective opportunity on their own.
The fix is not abandoning lagging measures. Leadership still needs outcome data. The real improvement comes from pairing lagging measures with leading signals that give teams enough time to respond.
Weekly Leading Indicators EHS and Ops Should Review Together
These leading indicators give EHS and Operations teams a shared, actionable view of what is happening on the floor right now. Reviewed weekly, they help teams spot emerging risks, assign ownership, and act before issues escalate into incidents or disruptions.
Near-Miss Rate and Congestion Signals
Near-miss rate is a practical upstream EHS signal when teams use it to identify patterns before more serious outcomes appear. Rising near-miss counts can show that controls are weakening, especially when the pattern clusters by zone, route, or shift.
The operational mirror is congestion data. That includes pedestrian-forklift interaction volume, restricted-zone breaches, blocked clearways, and repeated crowding in the same area.
When both signals rise in the same zone or on the same shift, the cause usually points to a site condition that deserves action. Examples include poor traffic separation, a layout issue, a handoff problem, or a route that pushes people and vehicles into the same space.
- Owner: EHS plus the operations supervisor for that zone.
- Cadence: Review weekly, with immediate escalation when a defined threshold is crossed.
Corrective Action Close-Out Rate
Corrective action close-out rate tracks the percentage of open actions closed within a defined window, such as 14 days. A growing backlog of overdue items signals that known problems are staying open.
That matters for safety and operations. An unresolved equipment issue, blocked walkway, process gap, or training issue can repeat until someone owns the fix.
- Owner: Shared. EHS logs the action. Operations usually owns the physical, process, or staffing change.
- Cadence: Weekly aging report.
Training Completion and Asset Readiness
Training metrics often get reduced to attendance. A stronger question is if the right people are prepared for the work they are about to do.
Pair training completion by job group, shift, and site with preventive maintenance completion and asset readiness. Together, these indicators show if the conditions for safe, uninterrupted production are in place before a shift starts.
Asset utilization data can strengthen this review by showing where equipment sits idle, where assets are overused, and which zones or shifts may need a different allocation.
- Owner: HR and EHS for training. Operations and maintenance for preventive maintenance and asset readiness.
- Cadence: Weekly scorecard, with escalation for anything overdue by more than one cycle.
Monthly Lagging Measures Leadership Still Needs
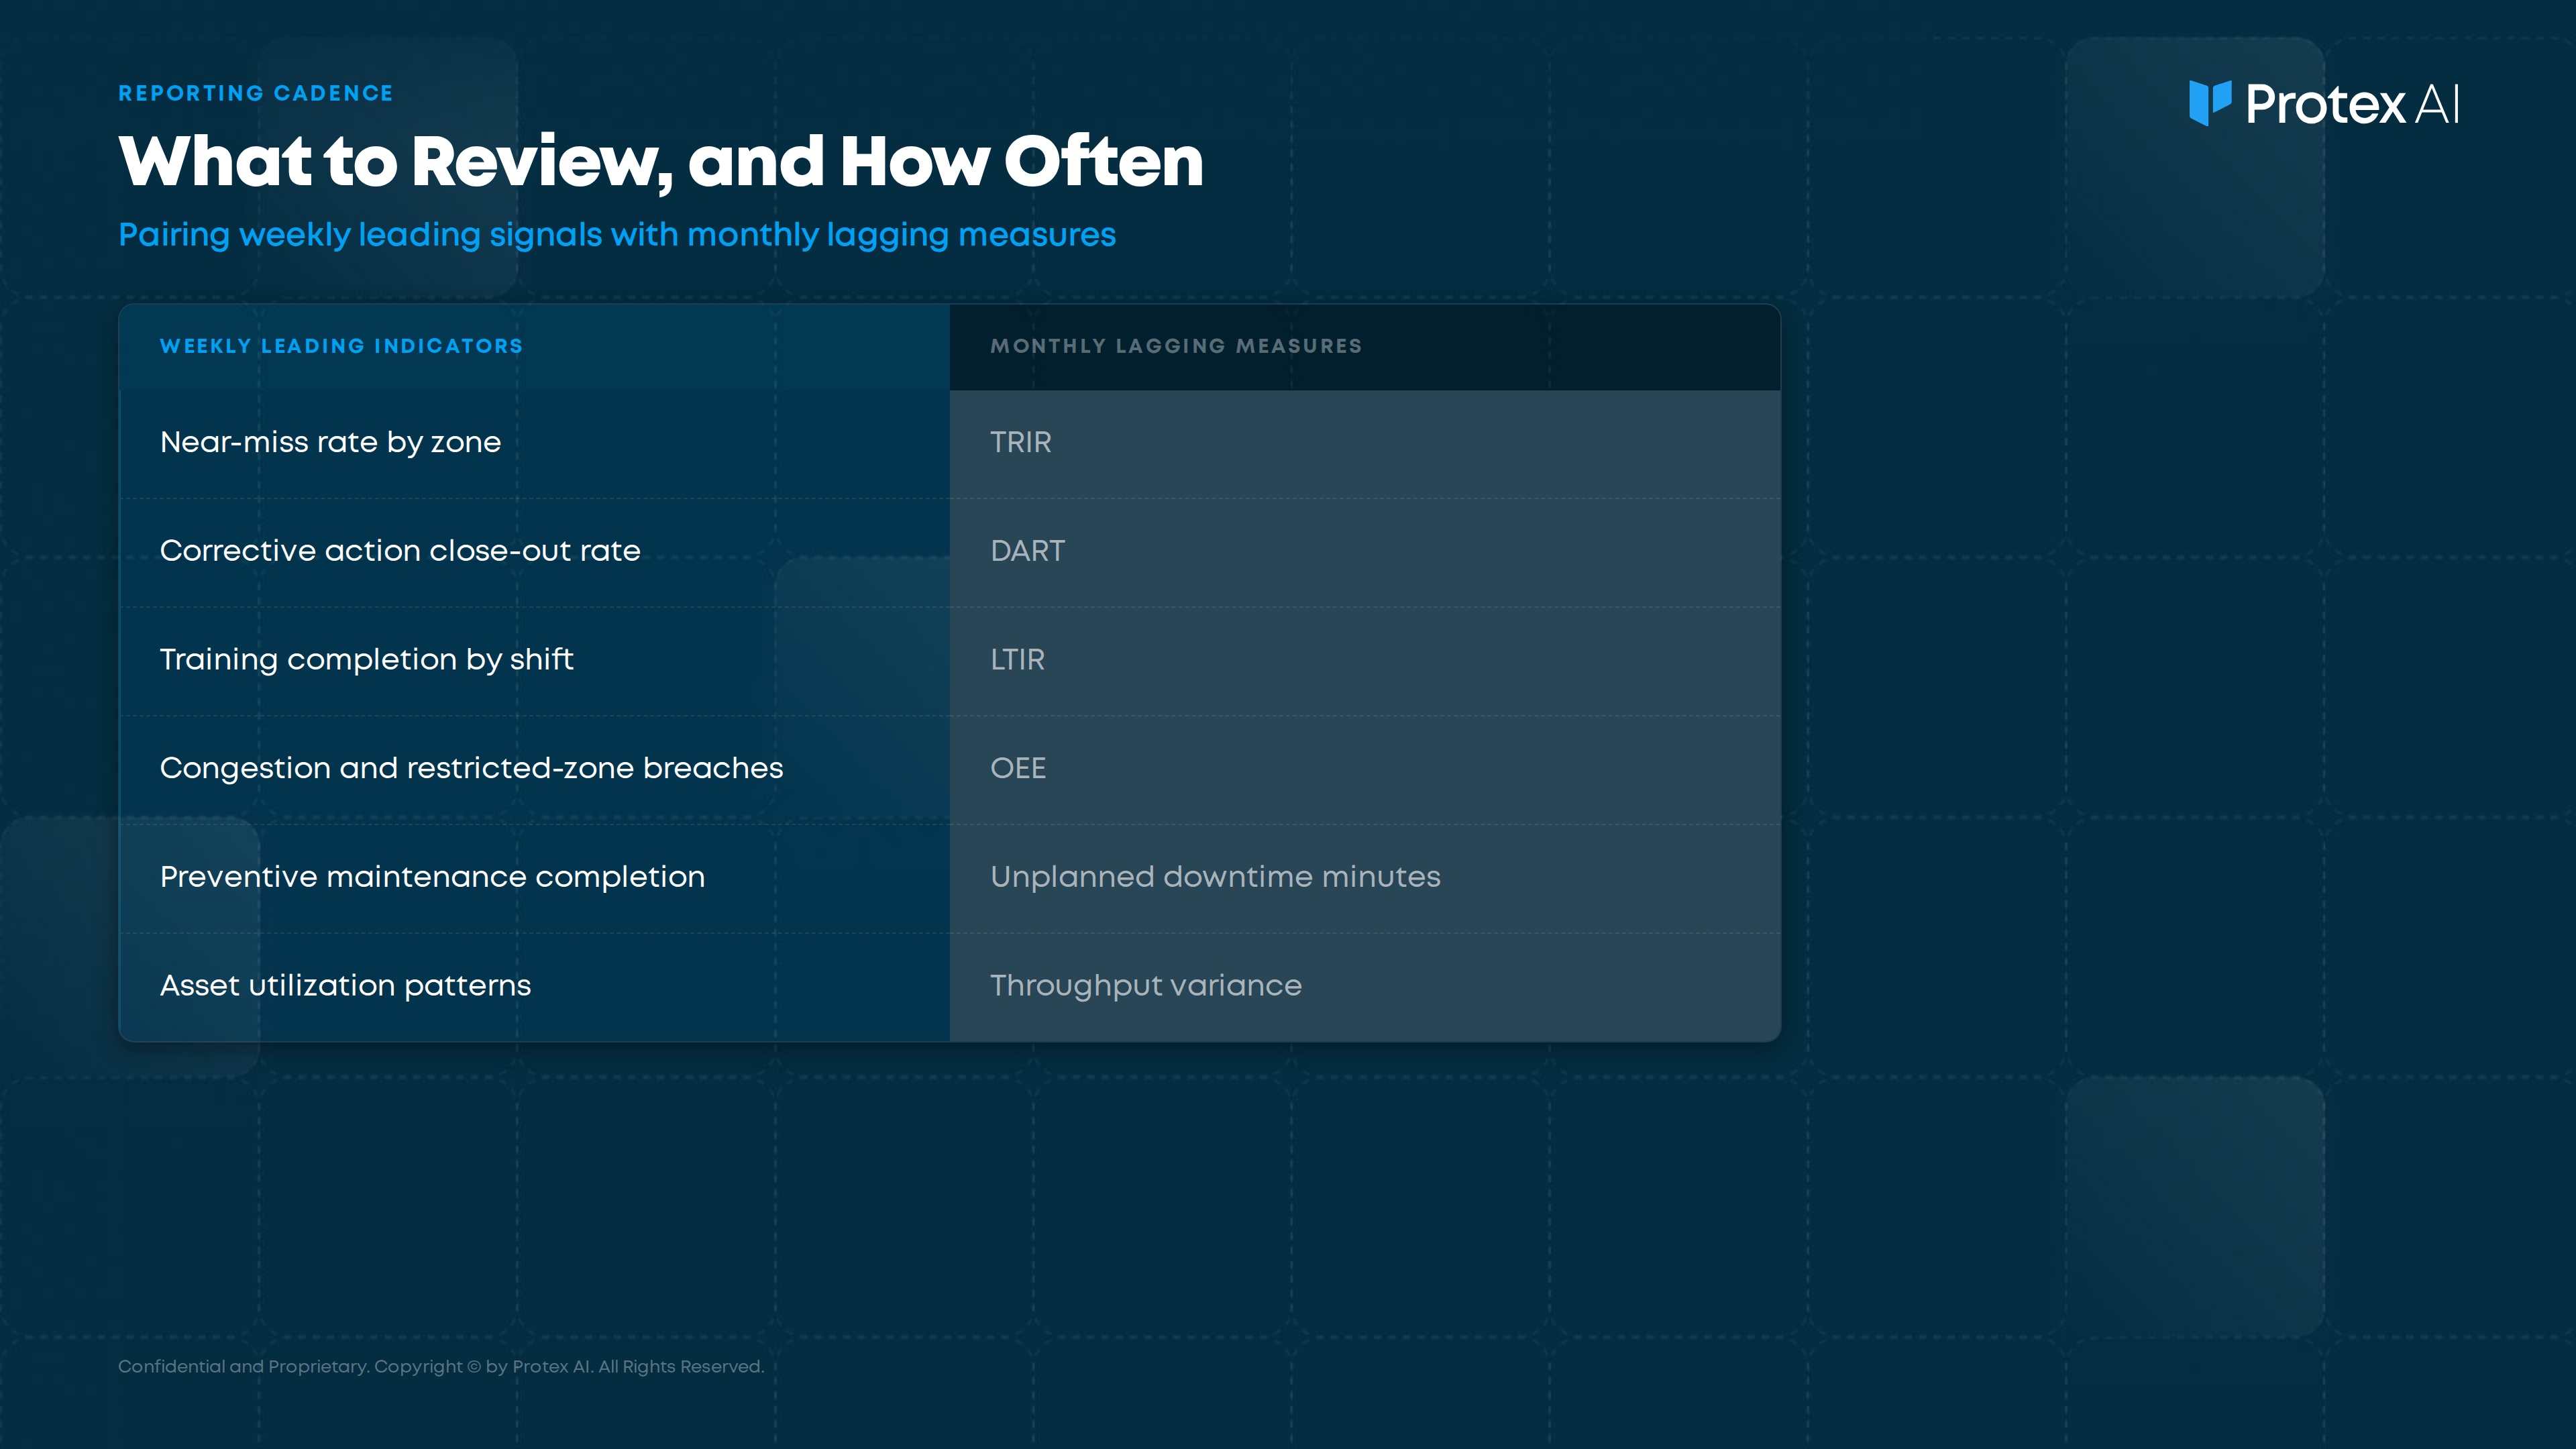
Lagging indicators act as the outcome scoreboard. They are necessary, but they cannot stand alone. Combining proactive and reactive signals gives leadership a fuller picture of workplace safety and site performance.
For the monthly leadership review, core lagging metrics include:
- EHS: TRIR, DART, and LTIR.
- Operations: OEE, unplanned downtime minutes, and throughput variance.
Monthly review is a practical cadence for lagging measures because these numbers move more slowly and reflect broader trends. Reviewing them weekly can create noise without much signal. The real value is trend confirmation. Leadership can check if weekly leading indicators align with later outcomes.
How to Segment Signals by Shift, Zone, Department, and Site
Most EHS and operations metrics look clean at the site level, but become more useful in the details. A clean site-level average can still hide one shift, zone, or department where risk is rising.
Segmentation helps teams see where to act before a recordable injury, downtime event, or missed target appears in the monthly report.
- Shift
A strong site average can mask one shift running at a higher risk or lower consistency. Shift-level cuts show where training, supervision, staffing, or process adherence needs attention.
- Zone
Congestion, near misses, corrective action backlogs, and blocked clearways often cluster in specific areas. Zone-level data makes that pattern visible.
- Department
Some departments carry a higher inherent risk or different operational pressures. Separating their numbers prevents their patterns from being averaged away.
- Site
Multi-site operations need cross-site comparisons to spot where one location is drifting. A site may look stable in isolation but fall behind when compared with similar locations.
Facility flow data can help teams connect movement patterns, route deviations, and congestion to both safety and operational performance. That makes segmentation practical instead of theoretical.
A Shared Review Cadence With Owners and Actions
Leading and lagging indicators work best when they become an operating rhythm, not another static dashboard. The review needs a clear owner, a trigger for escalation, and a documented action path.
Weekly Joint Review
- Audience: EHS plus the operations supervisor.
- Metrics: Near-miss rate, corrective action aging, training completion, congestion hotspots, blocked clearways, and asset readiness by zone.
- Output: Flag any metric above threshold, assign an owner, and set a resolution date.
Monthly Leadership Review
- Audience: Plant manager plus EHS manager.
- Metrics: TRIR, DART, LTIR, OEE, unplanned downtime, and throughput variance.
- Output: Compare month-over-month trends and check if weekly leading indicators align with later results.
Quarterly Calibration
- Audience: Executive sponsor plus multi-site leaders.
- Metrics: Site-level comparison across leading and lagging indicators.
- Output: Reallocate resources, update thresholds, and close the loop on repeat risk patterns.
Assign Ownership Before the Review Ends
The review only works when every flagged signal has an owner, a due date, and a way to confirm that the fix changed the pattern.
Connect Site Signals to Reports and Workflows
Protex connects the digital record and the physical reality of a site. Operational systems can show when and where a metric changed, while site intelligence can help teams identify the zone, shift, route, or pattern behind the change.
Protex Intelligence helps teams compare sites, shifts, risk patterns, and operational signals in one view, so EHS and Operations can see where a location or shift is drifting before the monthly review. Reporting and workflows can then help teams turn those signals into repeatable reports, dashboards, and follow-up actions.
Protex supports this work with privacy-preserving architecture. Event detection, blurring, and encryption happen on local edge devices, raw CCTV footage does not stream off-site, and relevant clips are anonymized before they appear in cloud dashboards.
Escalate Threshold Breaches Before the Next Meeting
Escalation matters as much as cadence. When a leading indicator crosses a threshold mid-week, the team should not wait for the next meeting. A defined escalation path separates a basic scorecard from a real action system.
Common Questions About Leading and Lagging Indicators
What is the difference between leading and lagging indicators?
Leading indicators show where safety or operational risk may be building before a larger event occurs. Lagging indicators measure outcomes that already happened, such as injury rates, lost time, downtime, or missed output.
EHS and Operations should track both together. Leading indicators help teams act earlier, while lagging measures show if those actions improved outcomes.
What are examples of safety leading indicators?
Practical safety leading indicators include:
- Near-miss rate: Rising counts can show that controls are weakening, especially when reviewed by shift and zone.
- Corrective action close-out time: A growing backlog of overdue items signals unresolved risk.
- Training completion by shift: This shows if the right people are prepared before work starts.
- Audit findings closed on time: Overdue audit items show identified risks that still need action.
- Inspection frequency by zone: Consistent inspection activity in high-risk areas gives teams a controllable signal tied to ownership.
Each metric needs to be controllable and tied to a named owner. Without ownership, leading indicators become passive reporting.
Can operations metrics be leading indicators for safety?
Yes. Operations metrics can act as safety leading indicators when they reveal site conditions that increase risk.
Unplanned downtime trends, congestion patterns, idle equipment in high-traffic zones, and asset use gaps can all point to conditions where safety events are more likely. The signal becomes more useful when teams segment the data by shift and zone, then assign a clear action owner.
EHS and Operations are not managing separate floors. They are reading the same site from different angles. A shared scorecard pairs weekly leading indicators with monthly lagging outcomes, giving both teams enough visibility to act before the cost lands.
Turn Shared Indicators Into Action
EHS and Operations need more than separate scorecards. They need a shared view of site signals, risk patterns, flow issues, and overdue actions.
The goal is simple: use operational intelligence and leading indicators to act earlier, then use lagging measures to confirm if the action changed the outcome.
Protex Intelligence helps EHS and Operations teams surface shared leading indicators, compare patterns across sites, and prepare data-backed reviews. Request an EHS and Operations KPI walkthrough.
Check Out Our Industry
Leading Blog Content
EHSQ industry insights, 3rd Gen EHSQ AI-powered technology opinions & company updates.
.jpg)
.avif)
.avif)