

%20(33).png)
Warehouse congestion heatmaps are most useful when they help teams decide what to change, not just where activity is concentrated. A hot zone needs context from comparable shifts, workload, movement patterns, and site-system data before it becomes an action.
Protex AI combines operational records with privacy-preserving computer vision to help teams trace recurring congestion, test a focused intervention, and measure the result against the original baseline.
What we’ll cover:
- Occupancy, dwell, movement, and configured event signals show different parts of the congestion picture.
- Comparable shifts and workload levels help separate normal peak traffic from repeatable flow friction.
- Route overlays can surface recurring detours, crossings, and staging pressure that support root-cause analysis.
- One low-cost change should be measured against travel time, queue duration, detours, or completed moves before scaling.
What A Congestion Heatmap Shows About Travel Time
A congestion heatmap is one view within a broader set of site signals:
- Occupancy and dwell data show how long people, pallets, or equipment remain in a configured zone. High dwell around a staging area can flag a constraint worth investigating.
- Movement and path data show aggregate flow within configured camera views and zones. Repeated deviations from a planned route can surface routing friction.
- Event-based hotspots flag configured events or conditions, such as repeated traffic overlap at an intersection. That pattern can point to a recurring conflict between workflows sharing the same space.
These signals add context, but they do not prove a root cause on their own. Site systems and operational data, including WMS records, show when and where a task happened.
Configured camera-zone data can show conditions around that period, such as converging forklift traffic or a dock queue. Fusing both sources supports evidence-backed root cause analysis. Area utilization adds layout context through occupancy and dwell patterns.
Privacy-Preserving Camera Data
Protex works with existing cameras. Privacy controls are configured for each deployment. Event context can be reviewed in accordance with the deployment's privacy configuration.
Protex AI does not use facial recognition or identify people, and each camera view stands alone. Analysis stays focused on configured zones, equipment, movement, dwell, congestion, paths, and process patterns. Teams can review the wider computer vision security controls alongside camera-derived operational workflows.
Normalize The Data Before You Trust A Hot Zone
A single hot color on one shift does not prove a structural problem. Before approving a layout change or forklift reroute, check if the pattern repeats under comparable conditions. Review similar shifts, wave releases, workload levels, and peak windows before treating the hotspot as persistent.
Raw counts also need context. A zone with more movement may simply be handling more picks, pallets, or vehicle traffic. One option is to compare movement, dwell, or congestion against an existing workload measure for the same period. That does not create a universal congestion rate. It creates a like-for-like baseline for testing excess friction.
Compare similar shifts or peak periods. If the same aisle or dock remains hot under comparable conditions, the pattern is worth tracing.
Trace The Routes Behind A Recurring Hotspot
Picture a T-junction where receiving forklifts meet pedestrians moving from picking to packing. If the zone stays hot across comparable shifts, trace the routes feeding it.
A facility flow analysis compares designed routes with aggregate movement inside configured camera zones. You might see repeated movement through a staging lane, or forklift flow returning through a one-way aisle. Comparing multiple periods helps separate a temporary obstruction from a repeated route deviation.
Mapping Movement With Facility Flow Data
When a recurring vehicle pattern needs a formal site rule, vehicle control can support safer, more consistent movement through high-conflict areas.
In one customer example, path evidence surfaced a congested U-shaped route where forklift and pedestrian traffic overlapped. The team separated the flows, restricted forklift access, and introduced hand-operated pallet jacks for shorter moves, addressing safety risk and flow friction.
Repeated forklift and pedestrian crossings create flow friction and injury risk. OSHA's warehousing hazards guidance addresses pedestrian traffic around forklifts, while its walking-working surfaces standard covers safe, orderly passageways and access.
Spotting Detours And Deviations
Lay the designed pick path or travel route next to the observed aggregate movement pattern. Flag gaps that repeat across comparable periods. A one-time deviation could reflect a temporary obstruction. A repeated gap can indicate a layout, signage, routing, or process issue that deserves a focused test.
Find The Root Cause Behind Warehouse Congestion
Start with a few congestion hypotheses and validate each against the available data:
- Slotting concentration - fast-moving SKUs concentrated in one high-demand pick zone
- Replenishment timing - refill runs overlapping with peak picking
- Staging overflow - pallets accumulating in a lane that cannot absorb the current volume
- Forklift routing - vehicle paths crossing pedestrian routes or conflicting with one-way rules
- Staffing coverage - queue pressure concentrated in a specific dock or shift window
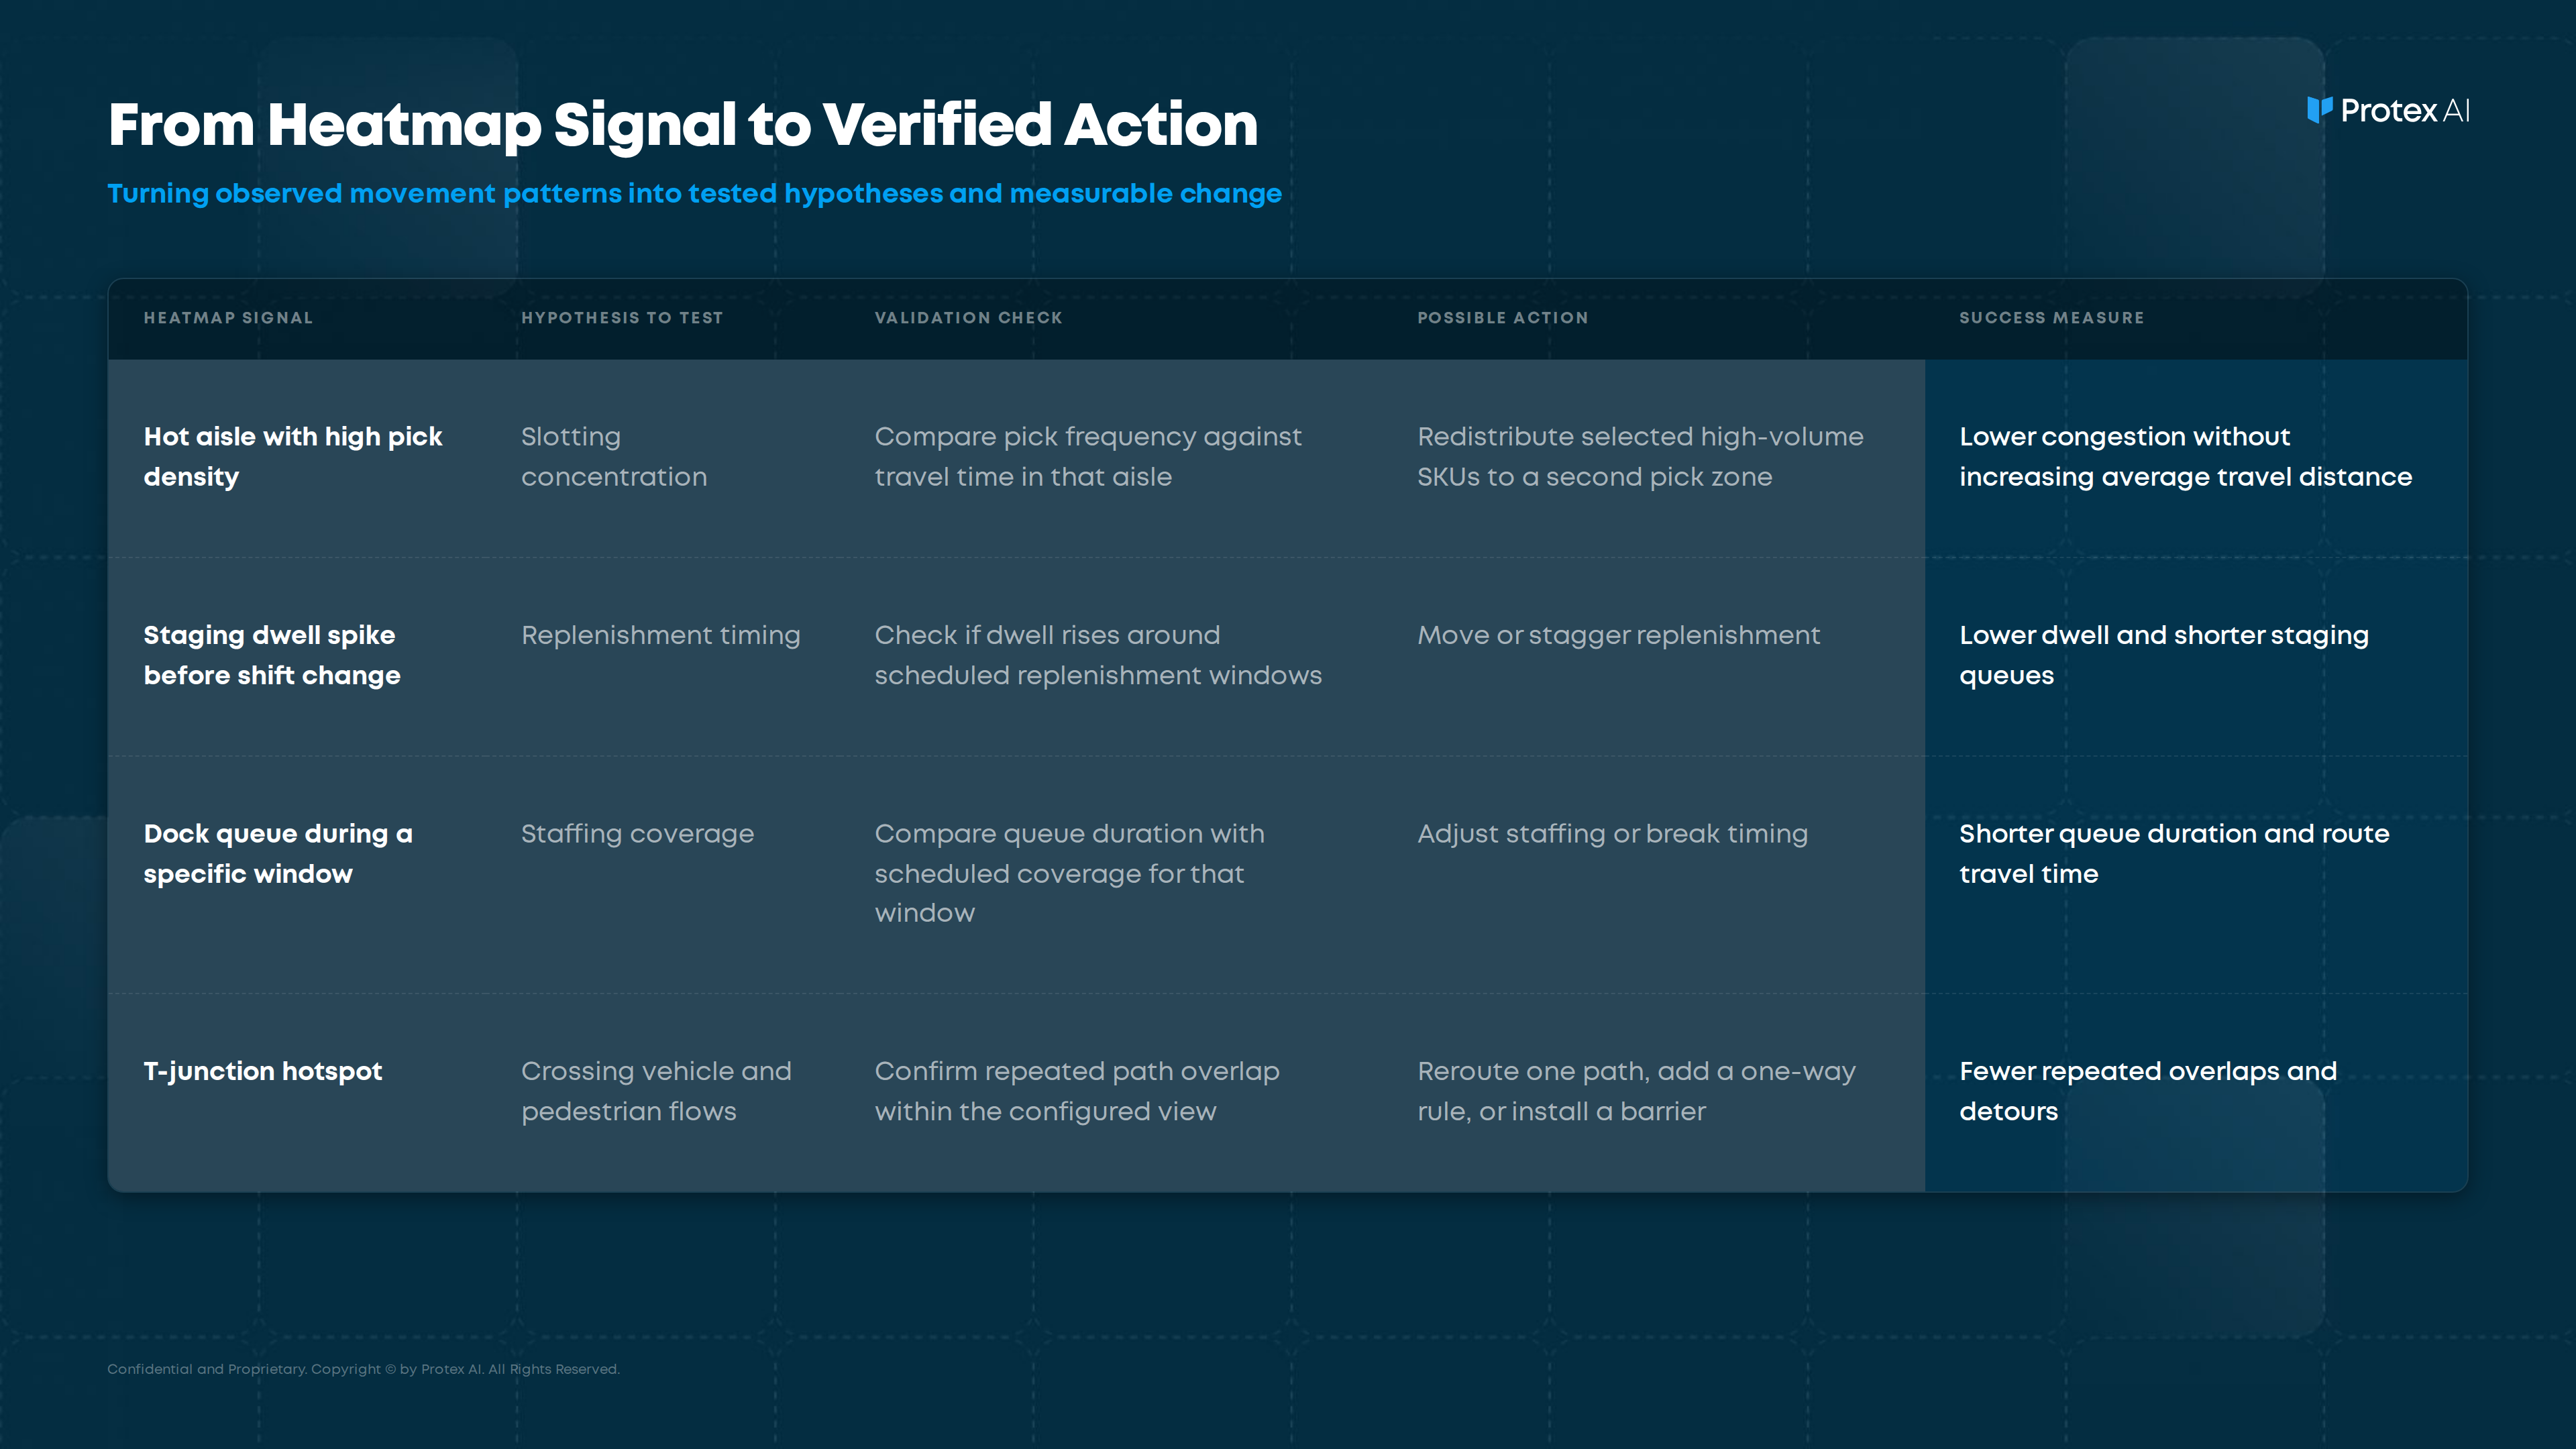
These findings can inform broader warehouse site Intelligence decisions while keeping the first intervention focused on one measurable problem.
Test One Change And Measure The Result
Once you have a supported hypothesis, establish the baseline and apply one low-cost change. Compare the target measure before and after under similar conditions. Multiple simultaneous changes make attribution harder.
Useful measures include:
- Congestion minutes or queue duration in the affected zone
- Traverse time across the route in question
- Repeated detours or path overlaps
- Completed moves or picks per hour for the same operating window
Keep the measures in the same operational scorecard so each test starts and ends with a defined target.
Picking A Low-Cost Test
Size the intervention to the finding:
- Change one route or add a one-way rule at a single intersection
- Re-slot a small number of SKUs out of an overloaded zone
- Adjust coverage for a recurring queue window
- Redesign one staging area before changing the wider floor
Comparing Before And After
Read the before-and-after results against the metric tied to the original hypothesis. If the test targeted dock queue time, confirm queues duration changed at that dock during a comparable window.
A general rise in activity does not confirm the intervention worked. Scale only after the target measure shows a meaningful improvement under similar conditions.
Common Questions About Warehouse Congestion Heatmaps
What does a warehouse congestion heatmap show?
It shows where aggregate activity accumulates over time within configured warehouse zones, using views such as occupancy, dwell, movement, paths, and configured event hotspots.
How do heatmaps reduce warehouse travel time?
A heatmap helps locate recurring friction. Travel-time improvement comes from tracing the pattern, testing one change, and confirming the target metric improved.
How long should warehouse movement data be collected?
There is no universal collection period in the Protex source material. Use representative windows covering the relevant shifts, workloads, and peak conditions. One isolated hotspot is not enough evidence to call an issue structural.
What is the difference between an occupancy heatmap and an event heatmap?
An occupancy heatmap shows presence or dwell within a configured zone. An event heatmap shows the location and frequency of configured conditions, such as recurring traffic overlap. Both work best alongside movement and operational data.
Close The Loop On Warehouse Congestion with Protex AI
A warehouse heatmap becomes useful when it leads to a specific decision. Pick one recurring hotspot, compare like-for-like operating periods, trace the movement feeding it, and test one focused change. Then measure the same travel-time, queue, path, or throughput metric against the original baseline before extending the change elsewhere.
Protex AI connects site-system records with privacy-preserving camera-zone signals so operations teams can move from a colored hotspot to evidence-backed action. See how Facility Flow & Layout Insights supports route, congestion, and layout decisions across industrial sites.
Check Out Our Industry
Leading Blog Content
EHSQ industry insights, 3rd Gen EHSQ AI-powered technology opinions & company updates.
.avif)
.avif)
