
.jpg)
TRIR means Total Recordable Incident Rate. Safety teams use TRIR to express OSHA-recordable workplace injuries and illnesses against total hours worked.
The rate stays comparable across sites because it reports recordable cases per 100 full-time equivalent (FTE) workers.
Quick takeaways:
- TRIR uses the standard formula (Total recordable cases × 200,000) ÷ Total hours worked.
- A 200,000-hour base represents 100 workers working 40 hours per week for 50 weeks.
- The denominator should reflect hours actually worked, not paid time off.
- The BLS incidence rate method describes the standard calculation and denominator rules used for incidence rates.
- TRIR reports outcomes after incidents occur, so teams often pair TRIR with leading indicators such as near-misses, unsafe behaviors, and hazard observations.
BLS also publishes BLS annual incidence-rate tables by industry. Those tables help teams compare TRIR trends against a NAICS benchmark.
What TRIR measures and what it misses
TRIR is a lagging metric. It summarizes recordable cases after they happen. It does not forecast future risk.
TRIR counts cases that meet OSHA recordkeeping criteria. OSHA defines recordability triggers in OSHA’s recordable case criteria. Common triggers include medical treatment beyond first aid, days away from work, restricted work, job transfer, or loss of consciousness.
A pattern usually sits under a single recordable case. Near-misses, unsafe behaviors, and hazards rarely reach the OSHA 300 Log, yet those events signal elevated exposure.
Safety teams often review OSHA 300 Logs well after incidents occur. That cadence pushes EHS work toward investigation instead of prevention. Protex Intelligence supports earlier intervention by turning video-based observations into actionable leading indicator data.
Defining a recordable incident
OSHA recordability depends on recordkeeping rules, not severity alone.
- Medical treatment beyond first aid typically makes a case recordable. OSHA defines first aid and medical treatment in 29 CFR 1904.7.
- Days away, restricted duty, or job transfer typically make a case recordable under OSHA’s recordkeeping criteria.
- Loss of consciousness related to work typically makes a case recordable even when no further treatment occurs.
- Log updates still matter after the initial entry. OSHA’s recordkeeping rule requires updates to the OSHA 300 Log during the retention period when a case classification changes.
Limits of lagging indicators
TRIR appears after a case reaches the OSHA 300 Log. That lag limits intervention speed.
Leading indicators provide earlier visibility. Near-miss capture, unsafe behavior observations, and hazard reports create opportunities to correct risk drivers before recordable cases occur.
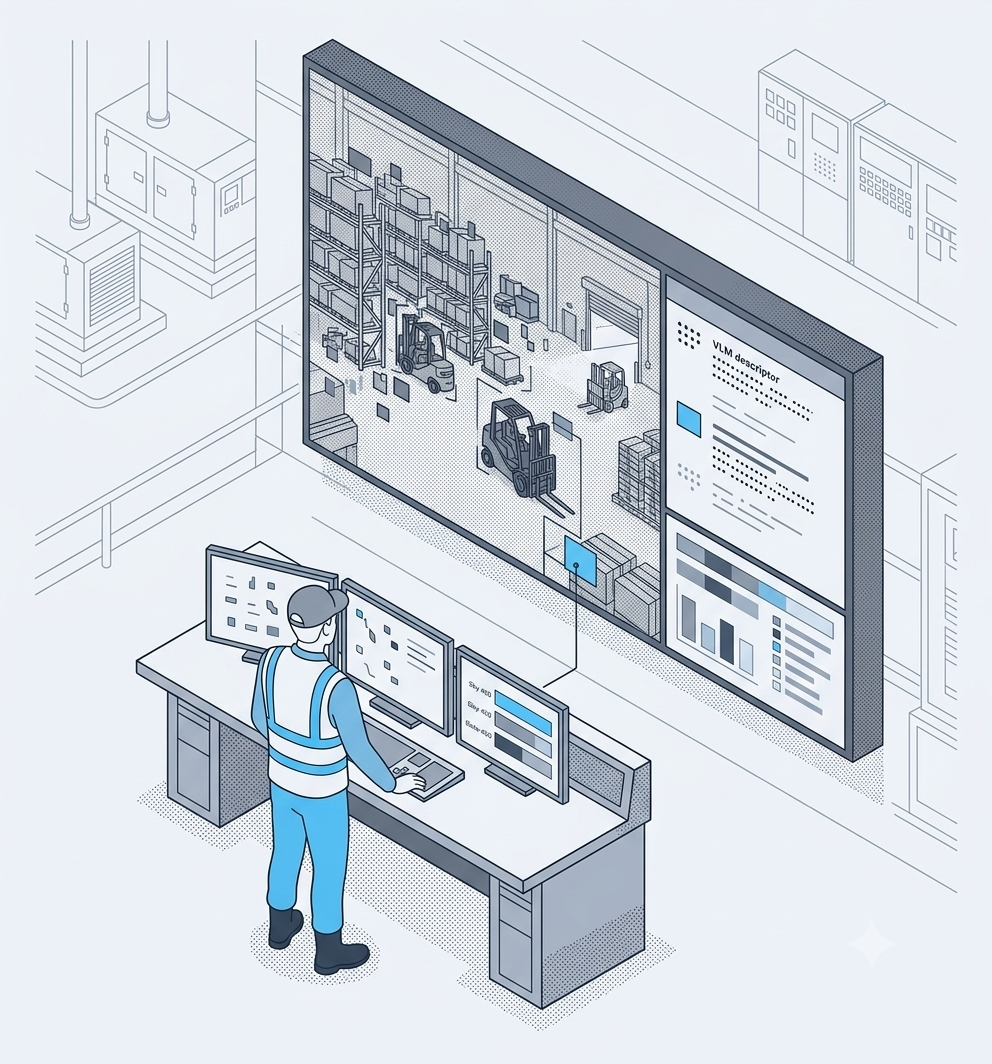
In camera-covered areas, computer vision can capture high-volume observations that traditional walk-through programs miss, especially across nights and weekends.
Protex AI can process video on an on-site edge device and share only short, anonymized clips for review. That approach supports privacy expectations while still giving teams concrete coaching moments.
The gap between compliance and operational safety
A low TRIR does not prove a hazard-free environment. Under-reporting and delayed classification changes can also suppress rates.
Teams reduce real risk when they can see the conditions that precede incidents. Distributed operations such as retail and wholesale need scalable observation systems because manual programs do not cover every shift, aisle, or loading bay.
How to calculate TRIR correctly
Use a consistent process and document assumptions so the rate stays comparable over time.
- Count recordable cases using the OSHA 300 Log
- Sum total hours worked for the same period
- Multiply cases by 200,000
- Divide by total hours worked
The formula explained
TRIR = (Total recordable cases × 200,000) ÷ Total hours worked.
A facility with 5 recordable cases and 400,000 hours worked calculates TRIR as:
(5 × 200,000) ÷ 400,000 = 2.5
A TRIR of 2.5 means 2.5 recordable cases per 100 FTE workers for that period.
The normalization lets a small site compare against a larger facility, including an industrial manufacturing network, without workforce size distorting the comparison.
Why the 200,000-hour benchmark matters
A 200,000-hour base reflects 100 workers working 40 hours per week for 50 weeks, which is the standard incidence rate basis described in the BLS method.
A small workforce can see a high TRIR from a single case because a smaller denominator increases the rate.
Example: 1 recordable case and 40,000 hours worked yields:
(1 × 200,000) ÷ 40,000 = 5.0
Common mistakes that skew TRIR
Classification errors and denominator errors can inflate or deflate TRIR, which weakens trend analysis and can complicate audits.
Misclassifying first aid as recordable
Logging a first aid case as recordable inflates TRIR. OSHA’s first aid list in 29 CFR 1904.7 helps teams keep treatment decisions consistent.
Missing valid recordables
Prescription medication at prescription strength, restricted duty, or job transfer can convert a case into recordable. Clinic notes and restrictions should be reviewed against OSHA criteria and then documented.
Using the wrong hours-worked denominator
Estimated hours create a compounding error. Paid nonwork time can also distort the denominator.
The BLS method uses hours actually worked for the denominator.
Practical controls:
- Pull hours from payroll timekeeping
- Include part-time hours
- Exclude vacation, sick leave, and holidays
Failing to update the OSHA 300 Log
Case outcomes can evolve. An initial first aid classification can change after follow-up care.
OSHA recordkeeping rules require updates to the OSHA 300 Log during the retention period when case status changes.
Miscounting contractor cases
Contractor injuries affect site risk reviews even when the contractor employer maintains its own OSHA 300 Log.
OSHA recordkeeping coverage often turns on who supervises the work day to day. OSHA addresses coverage and recordkeeping responsibility concepts in OSHA’s coverage and supervision rule in 29 CFR 1904.31.
Moving from TRIR to leading indicators
TRIR supports benchmarking and compliance. Leading indicators support prevention.

Identifying visual root causes
Visual root cause analysis uses video evidence to tie precursors to environmental or behavioral patterns.
Traditional investigations rely on interviews and post-incident artifacts. AI-enabled cameras can capture near-misses and context, which strengthens coaching and corrective actions.
A forklift operator cornering too fast might not create a recordable case today. The behavior still increases collision likelihood. Captured clips make feedback concrete.
Turning near-misses into trend data
High-volume near-miss capture builds a stronger baseline for trend detection.
Manual observation programs record only a fraction of hazards. Continuous monitoring creates data points that show repeat patterns.
A loading dock with frequent near-miss events signals a systemic control gap. Early corrective action prevents the recordable case that would later raise TRIR.
5 Actionable levers to reduce incident rates
Use leading indicator data to target controls that reduce exposure. Recent government statistics in the UK Health and Safety Executive key figures estimate the cost of workplace injuries and ill health from current working conditions at £22.9 billion per year in Great Britain.
- Automating hazard detection
AI-powered cameras detect unsafe behaviors across shifts. Continuous coverage can capture off-shift risk that floor walks miss.
- Improving toolbox talks with site footage
Clips from a real facility increase relevance. Teams can discuss a near-miss in the exact aisle, dock, or machine zone where it occurred.
- Linking safety insights to throughput constraints
Leading indicator data can highlight congested pathways and recurring conflicts that slow movement and raise injury exposure. Correcting the traffic pattern can reduce risk and reduce delay.
- Standardizing multi-site benchmarks
Multi-site leaders need unified dashboards to compare locations consistently. Protex AI supports network-level visibility across camera-covered areas.
- Implementing corrective actions faster
Real-time alerts shorten the feedback loop. Faster correction reduces exposure time across subsequent shifts.
Frequently asked questions about TRIR
What is a good TRIR for manufacturing?
A strong target compares against your NAICS benchmark and stays below the industry rate for your segment. BLS incidence-rate tables provide the benchmark reference, and the same BLS method supports consistent calculation. This section uses the BLS tables source already linked earlier.
Does a high TRIR increase insurance costs?
Insurers can consider claim history, claim severity, and trend stability during underwriting. TRIR trends can also surface during risk reviews.
How often should TRIR be calculated?
Monthly calculation supports faster trend detection than annual rollups. Sites with high operational change can benefit from more frequent internal checks, as long as hours and case classifications stay consistent.
Can contractor hours be included in TRIR?
TRIR uses the cases that belong on your OSHA 300 Log and the corresponding hours worked for your workforce definition. OSHA recordkeeping coverage depends on employment and supervision factors, including day-to-day direction.
See how Protex surfaces leading indicators
Spreadsheet calculations summarize the past. Leading indicator programs reduce future risk when teams can see precursors and close the loop fast.
Request a walkthrough for reporting teams to see how Protex AI turns existing camera infrastructure into actionable safety insights that reduce recordable cases and lower TRIR over time.
Check Out Our Industry
Leading Blog Content
EHSQ industry insights, 3rd Gen EHSQ AI-powered technology opinions & company updates.

.jpg)