

%20(23).png)
A warehouse operations manager playbook should help you run steadier shifts with fewer surprises. It should show where flow breaks down, where standard work slips, and which actions lift throughput without adding more headcount or floor space.
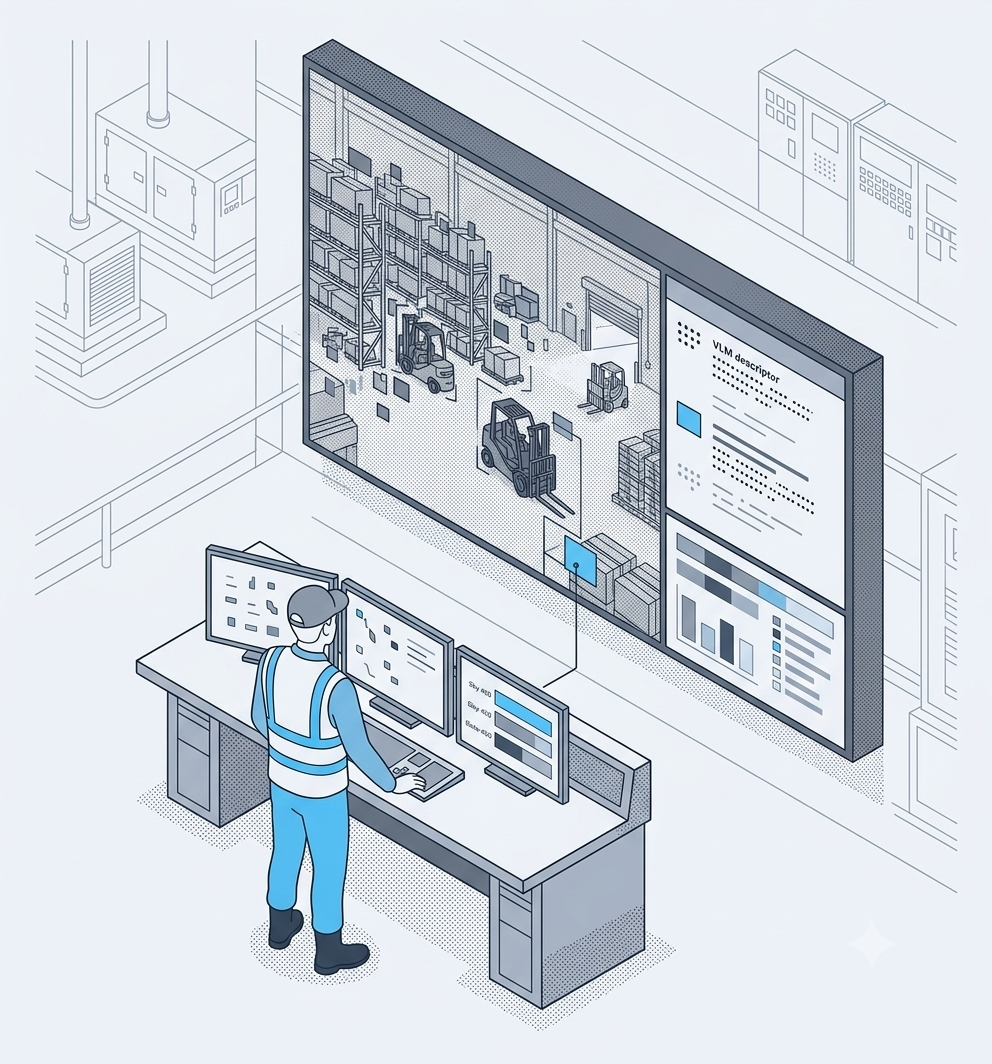
That’s where live operational visibility changes the job. Instead of waiting for incident reports, managers can spot blind spots, recurring traffic conflicts, and hidden time loss while the shift is still running.
The Five Moves at a Glance
Here are five practical moves that belong in a modern warehouse operations manager playbook.
- Surface blind spots with computer vision for warehouse operations, so supervisors can see unsafe crossings, congestion, and repeated friction points on the floor.
- Use area use data to spot bottlenecks, dead zones, and layout issues before you spend money on expansion.
- Tighten standard work with clearer shift handovers, weekly coaching, and Protex Intelligence reports that keep day and night teams aligned.
- Track leading indicators with Predictive Analytics, so you can act on near misses, hotspot trends, and open actions before downtime hits plan.
- Tie every improvement back to output, labor hours, and equipment use, so you can show what changed and why it mattered.
Most warehouse managers know the feeling. A shift ends, a problem surfaces, and the real cause stays fuzzy. You still need to hit volume, keep people safe, and explain what happened to leadership.
A stronger playbook changes that cycle. It turns your current camera network into a source of operational evidence, then uses that evidence to guide layout changes, coaching, and daily decisions.
1. Start With Blind Spots, Not Incident Logs
Incident reports tell you what already went wrong. A warehouse operations manager needs signals earlier than that, especially in facilities where forklifts, pedestrians, loading docks, and staging areas compete for the same space.
Computer vision fills that gap. It captures the physical interactions that a WMS cannot see, such as repeated shortcutting through vehicle lanes, congestion at dock approaches, and unsafe crossings during shift change.
Protex runs event detection on local edge devices and sends metadata plus brief anonymized clips to the dashboard. That gives managers proof they can use in daily huddles without turning the floor into a surveillance project.
Where to focus first
Start with the places that carry the most operational drag.
- Docks with frequent queuing
- Intersections with mixed pedestrian and forklift traffic
- Staging areas where inbound and outbound flows overlap
- Aisles where teams keep cutting across intended routes
For vehicle-heavy zones, vehicle control gives a more direct fit than a broad warehouse dashboard. It helps teams see where powered industrial trucks and pedestrians keep colliding in the same space.
One Protex deployment with a global food distributor reported an 800% increase in visibility into near misses after moving from manual reporting to automated detection. That kind of jump gives supervisors far more chances to fix patterns before they turn into stoppages.
2. Fix Flow With Real Movement Data
Many warehouses still rely on walk-throughs and snapshots to judge flow. Those checks help, but they rarely show how people and vehicles move across a full shift.
Path mapping changes that. It shows the actual routes people and equipment take, where traffic bunches up, and which routes stay underused even though the process map says they should carry the load.
Turn congestion into an action list
Movement data helps you answer practical questions fast.
- Which aisle creates repeated slowdowns?
- Which intersection needs a route change?
- Which staging area keeps pulling traffic off the intended path?
- Which section of the building sits idle while another section stays overloaded?
That is where risk heat maps and area views start to matter. They turn vague complaints about congestion into visible patterns that supervisors can test and fix.
One customer used path mapping to spot a congested U-path where forklift and pedestrian traffic overlapped more often than expected. The team rerouted traffic, tightened access in that zone, and reduced congestion while improving safety.
Use the data before you spend on CapEx
Layout changes do not always need construction. Sometimes the fix is a route change, a barrier, a new staging rule, or a better handoff between dock and floor teams.
Protex reports throughput gains of about 15% from faster material flow and reduced delays after teams remove bottlenecks and improve traffic flow. That makes movement data useful for two decisions at once: fix what you can now, then build a stronger case for larger layout changes if the site still needs them.
3. Standardize Shift Execution
Cross-shift drift hurts output fast. One crew follows the planned route, another takes shortcuts, and the same issue keeps showing up with a different supervisor's name attached to it.
A practical warehouse operations manager playbook needs a handover that covers flow, safety, and open actions in one place.
What a handover should include
A handover works best when it stays short and specific.
- Near misses and hotspot areas from the last shift
- Equipment, dock, or floor issues that could slow the next team
- Temporary traffic changes or blocked routes
- Open actions, named owners, and the next checkpoint
That format gives the incoming supervisor a real starting point, not a vague warning that the shift was “busy.”
Coach with clips, not general reminders
Managers get better uptake from training when they can show the exact pattern they want to change. Brief anonymized clips help teams see the issue in their own environment, on their own routes, with their own constraints.
That makes toolbox talks sharper. You can show the unsafe crossing, explain what triggered it, and agree on one clear fix for the next shift.
A simple weekly review works well here.
- Pull the top recurring behavior or congestion pattern from the dashboard.
- Choose one or two clips that show the pattern clearly.
- Ask the crew what drove the shortcut, delay, or miss.
- Set one concrete action for the next week.
4. Track Leading Indicators That Protect Throughput
Lagging metrics still matter. You still need incident counts, downtime totals, and lost time data. Yet a warehouse manager cannot wait for those numbers alone.
Leading indicators show where the next slowdown or safety event is building.
Leading indicators worth tracking
A strong warehouse operations manager playbook should track:
- Near-miss visibility by zone
- Repeated vehicle and pedestrian overlaps
- Congestion frequency at docks and intersections
- Blocked walkways or route deviations
- Corrective actions closed on time
Those signals line up well with OSHA’s guidance on leading indicators, and they fit the way operations teams already think about early warning signs.
The goal is simple. Spot recurring friction before it turns into lost output.
Connect risk to the production plan
Protex frames this well for operations leaders. The platform connects safety events with operational metrics, so managers can see how congested pathways, repeated route violations, or minor stoppages affect throughput.
That connection matters because it helps EHS and operations work from the same evidence. A near miss at a busy intersection is no longer “just a safety issue.” It is also a flow issue that can slow picks, dock turns, or line feeding.
5. Prove the Value in Operations Terms
Warehouse leaders rarely get budget for a dashboard alone. They get budget for fewer stoppages, steadier output, lower labor drag, and cleaner decisions on where to invest next.
That means your playbook needs an ROI section.
What to measure
Tie every improvement to metrics that leadership already watches.
- Downtime and micro-stoppage hours
- Throughput or picks per hour
- Labor productivity
- Audit hours saved
- Fleet and equipment loading
Those measures fit Protex’s operations persona well because they map to throughput, stoppage time, labor productivity, and operating cost savings.
Use proof points that speak to operations
Protex’s customer materials give you stronger business proof than generic safety language.
- Bendix identified downtime from a faulty robot that was costing more than 20 labor hours per day.
- Amazon projects more than 10,000 hours saved on site-level audits each year.
- Berry recovered £750k in funding after replacing a manual audit process with better documented proof.
For many teams, that’s the shift that lands with leadership. The conversation moves from “we think this helps” to “here is the drag we removed, here is the time we got back, and here is the output impact.”
Common Questions From Warehouse Operations Managers
How do you start without redesigning the whole site?
Start with one dock area, one high-traffic intersection, or one aisle cluster that creates repeat congestion. Use movement data for two to four weeks, test one layout or traffic change, then compare the before-and-after pattern.
What is the best first use case for existing cameras?
Most teams start with pedestrian and forklift overlap, dock congestion, or route deviation in one busy zone. Those use cases are visible, frequent, and easy for supervisors to act on.
How do you show value to leadership fast?
Pick one metric the site already trusts, such as downtime hours, pick rate, or audit time. Then pair it with one recurring floor issue and show what changed after the fix.
Build a Playbook That Sees the Floor Clearly
A warehouse operations manager playbook should do more than document procedures. It should help you see the floor as it runs, tighten standard work across shifts, and turn recurring friction into actions that protect output.
That is the practical upside of computer vision and operational reporting. You stop guessing where time, space, and attention are leaking away. You start fixing the specific routes, behaviors, and handovers that keep dragging performance down.
If you want to see how Protex applies that approach in live warehouse settings, start with its guide to warehouse safety and operations or request a demo.
Check Out Our Industry
Leading Blog Content
EHSQ industry insights, 3rd Gen EHSQ AI-powered technology opinions & company updates.
.avif)